


5 - Viewing Test Data
52
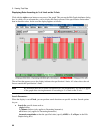
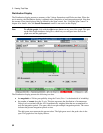
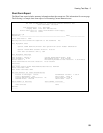
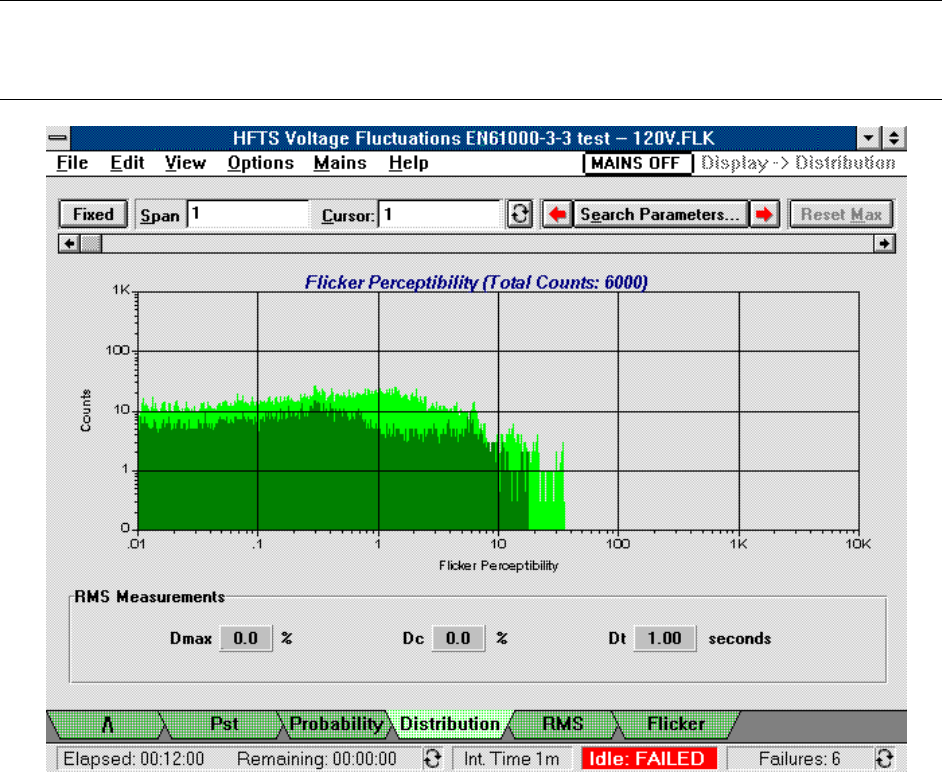
Distribution Display
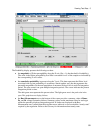
The Distribution display presents a summary of the Voltage fluctuations and Flicker test data. When the
test is running, the Distribution display is updated at the completion of each integration period. Note that
the amount of test data displayed may be limited by the Span control. See “Using the Span Control” in
chapter 6 for details. Also, the Search Parameters control is not active in this display.
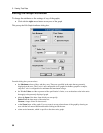
Note To edit the graph, click with the right mouse button on any area of the graph. This puts
up the Edit Graph Attributes dialog box, which lets you configure items such as the
graph axes and the graph span.
The Distribution display presents the following test data:
ñ the magnitude of flicker perceptibility along the X axis (Pst = 1 is the threshold of irritability)
ñ the number of counts along the Y axis. This data represents the distribution of instantaneous
flicker levels associated with the 1024 logarithmically weighted bins that are accumulated for
each Pst integration period. The span control can span multiple integration periods. The cursor
indicates the present integration period or time.
The dark green area represents the present value. The light green area is the peak value in the
span. This graph does not display failures.