


Searching for Specific Test Data - 6
67
Using the Zoom Control
The zoom control applies to the Time Series display, the Rms display, and the Flicker display. The time-
series display only shows a limited number of data bars. Zooming in lets you view individual data points in the
time series. Zooming out lets you view summarized information for larger blocks of measurement data.
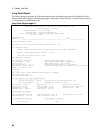
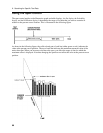
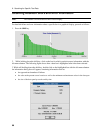
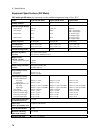
When the zoom factor is greater than 1:1, each bar represents the maximum value of two or more data
points. This is illustrated in the following figure
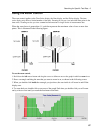
To use the zoom control,
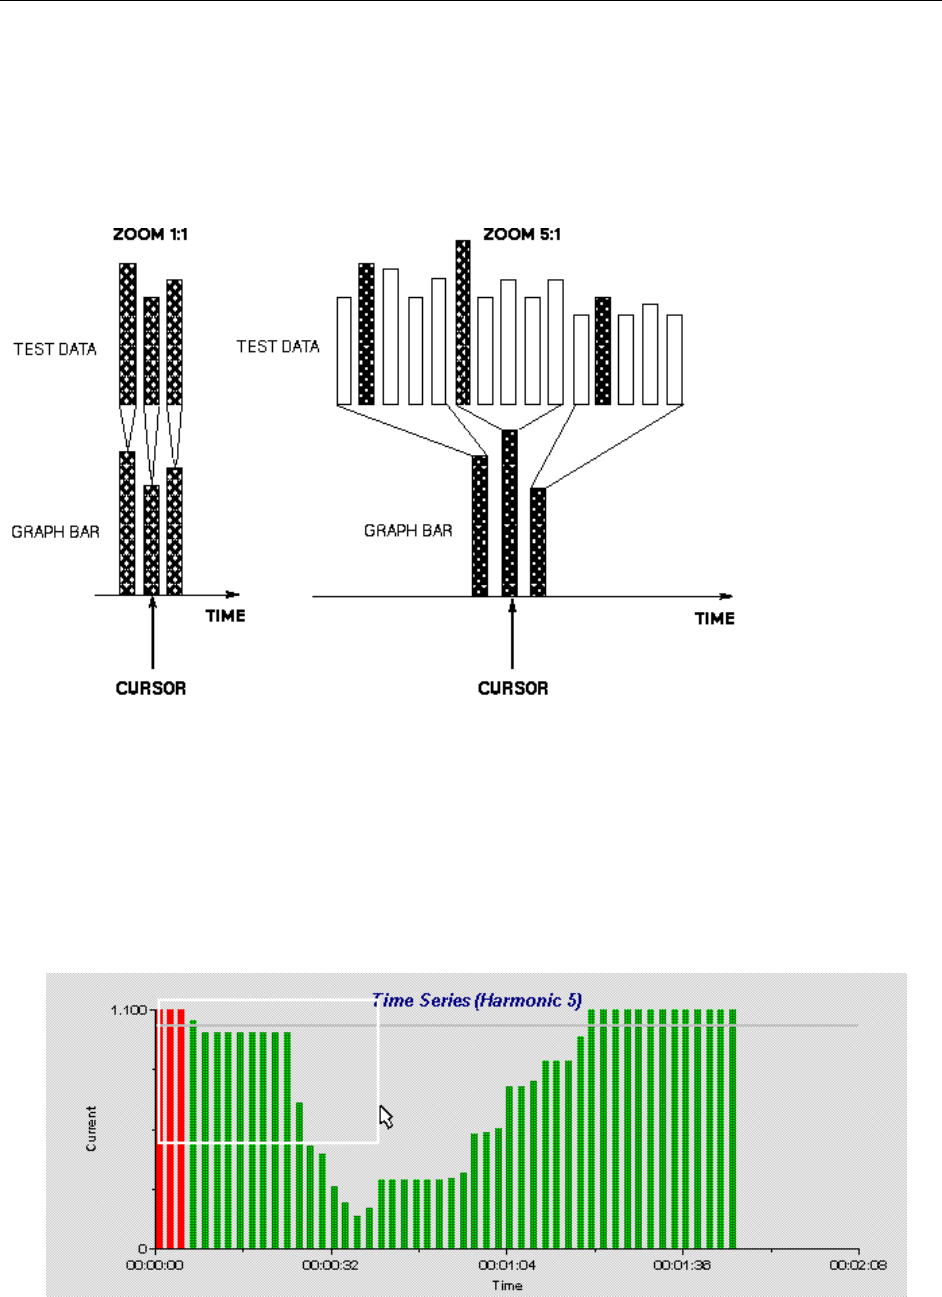
1. Hold down the left mouse button and drag the cursor to define an area on the graph in which to zoom in on
.
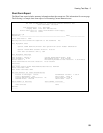
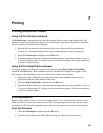
2. Draw a rectangle outlining the area that you want to zoom in on, as shown in the following screen.
3. When you double-click inside the rectangle you just drew, the area inside it will zoom in and fill the
display area.
4. To zoom back out, double-click on any area of the graph. Each time you double-click you will zoom
out by a factor of ten until you reach the maximum zoom limit.