


Viewing Test Data - 5
47
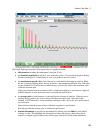
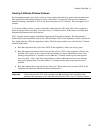
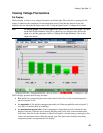
Viewing 2.5 Minute Window Failures
For fluctuating harmonic tests, limit values are more complex than those for quasi-stationary harmonics.
The regulation for fluctuating harmonics allows values up to 1.5 times the limits for quasi-stationary
harmonics during a maximum of 10% of any observation period of 2.5 minutes. This corresponds to 15
seconds.
A 2.5 minute sliding window is used to check that values between 100% and 150% of the regulation’s
limits do not persist for more than 15 seconds in any 2.5 minute window. If this limit is exceeded, then
that particular harmonic has failed the test.
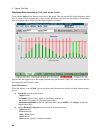
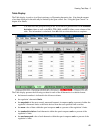
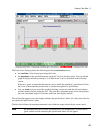
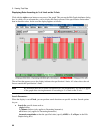
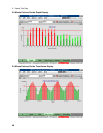
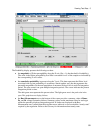
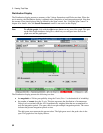
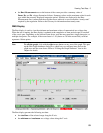
The 2.5 minute window applies to both the Graph and the Time Series displays. The failure band is
defined by the area between the yellow line, which indicates 100% of the regulation’s limits; and the red
line, which indicates 150% the regulation’s limits. The following conditions are valid for the 2.5 minute
window failure band:
ñ Bars that stop below the yellow line (100% of the regulation’s limits) are always green.
ñ Bars that appear between the yellow line and the red line (150% of the regulation’s limits) may
be either red or green. A bar is green if the total number of values within the two lines occur
during a time period of 15 seconds or less within the 2.5 minute window prior to the present
cursor location. A bar is red if the total number of values within the two lines occur during a
time period greater than 15 seconds within a 2.5 minute window prior to the present cursor
location.
ñ Bars that continue above the red line are always red. These values have exceeded 150% of the
regulation and represent individual failures by themselves.
Important Values that exceed 150% of the regulation are not included in the calculations that
determine the maximum event count that cannot exceed 10% of any 2.5 minute window.