


Introduction - 1
9
EN 61000-3-2 and EN 60555 Part 2 Regulations
EN 61000-3-2 and EN 60555 Part 2 regulate the magnitude of harmonic currents drawn by products
from the ac line. For example, harmonic currents can occur as a result of high peak currents drawn by
switch-mode power supplies. Power companies, particularly in Europe, have led a regulatory initiative to
limit harmonic current generation at the product level because of a variety of undesirable effects on the
mains environment such as: interference with other equipment, overheating of conductors and power
factor correction networks, and power transmission losses. Personal computers, peripherals, and variable
speed motor drives are examples of the types of products addressed by the regulations.
EN 61000-3-2 and EN 60555 Part 2 actually cover two categories of harmonic currents: quasi-stationary
harmonics and fluctuating harmonics. Power supply manufacturers, for example, may be concerned
primarily with the first category while product manufacturers may be concerned with both categories.
Different measurement techniques are used for determining compliance for the two categories, with more
stringent testing requirements applied to testing fluctuating harmonics. In particular, compliance testing
for fluctuating harmonics requires non-stop harmonic analysis over extended periods of time. The EN
61000-3-2 regulation applies to class A, B, C, D, and motor-driven equipment.
The EN 60555 Part 2 regulation only applies to class A and class B equipment. This regulation is
selected in the Options/Defaults menu. See appendix D for information about class determination.
Compliance Testing Implementation
The Agilent 14761A HFTS software compliance tests to EN 61000-3-2 / EN 60555 Part 2 as follows:
ñ It initializes and programs the Agilent 6800-Series AC Power Source/Analyzer.
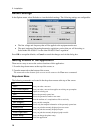
ñ After the pre-test, the software displays one cycle of voltage and current, which represents the
average of all half-cycle measurements made during the pre-test, with Class D envelope
information superimposed over the waveshapes. Rms voltage, frequency, rms current, peak
current, real power, apparent power, power factor, voltage distortion, current distortion, and
percent in envelope are displayed as well. An additional display indicates if the harmonic-by-
harmonic voltage distortion is either “IN SPEC” or ”OUT OF SPEC” as per the regulations for
source distortion. This is based on the worst-case results obtained during the pre-test.
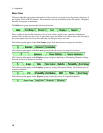
ñ During the compliance test, the software produces a real-time bar graph that represents either the
absolute magnitudes of 40 harmonics, or the magnitudes of 40 harmonics expressed as a
percentage of the applicable limits. The graph display shows both the maximum measured value
and the value of the present data record. The value of the present data record is continually
updated while the test is running. A time-series graph is available to display test data for a
specific harmonic.
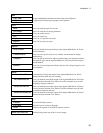
ñ The software also produces a table that displays either the absolute magnitudes of 40 harmonics,
or the magnitudes of 40 harmonics expressed as a percentage of the applicable limits in real-time.
The table shows both the peak data values and the present data values. Note that you can also
display the data of any individual harmonic versus time, either as an absolute magnitude or as a
percentage of the allowable limits.
ñ When testing fluctuating harmonics, the software uses a 2.5 minute sliding window. Within this
window harmonic peaks of up to 150% of the steady-state harmonic limits are allowed, provided
that these samples do not total more than 10% of the total samples (or 15 seconds of time) within
any 2.5 minute observation period. Samples that contribute to a 2.5 minute window failure must
fall between 100% and up to 150% of the steady-state harmonic limits. Values greater than 150%
of the limits are counted as individual failures.