


Viewing Test Data - 5
53
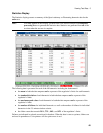
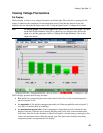
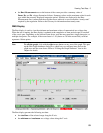
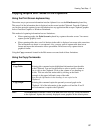
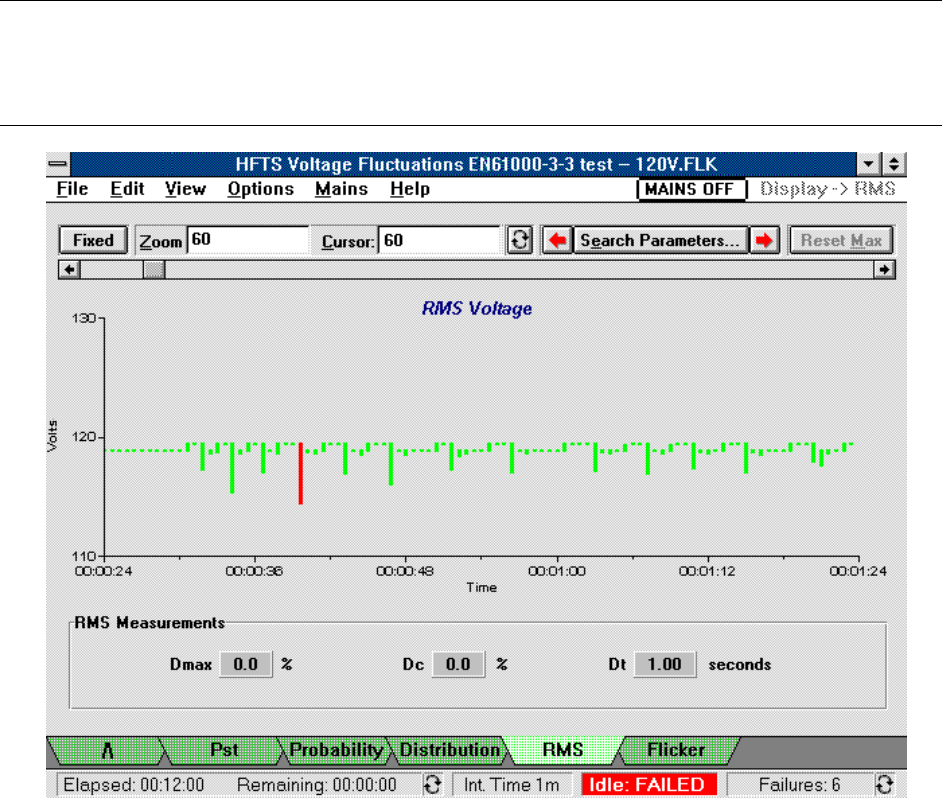
ñ the Rms Measurement area on the bottom of the screen provides a summary value of
Dmax, Dc, and Dt voltage fluctuation failures. Summary values are the maximum value for each
type within the presently displayed integration period. If dashes are displayed in the Rms
Measurement area, it means that the test either never achieved or never exited the “steady-state”
required by the regulation. Refer to the Glossary for information about steady-state.
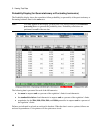
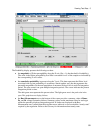
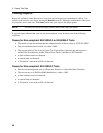
RMS Display
The Rms display is used to view the minimum and maximum values of summarized rms voltage data.
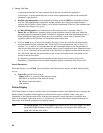
When the test is running, the Rms display is updated at the completion of time periods equal to one half
of the x-axis span. Depending on the selected zoom factor, each bar may represent a single data point, or
multiple data points. For example, if the zoom factor is 1:10 (shown as 10 in the zoom field), each bar
represents 10 data points.
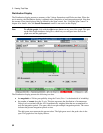
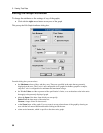
Note To edit the graph, click with the right mouse button on any area of the graph. This puts
up the Edit Graph Attributes dialog box, which lets you configure items such as the
graph axes and the zoom factor. Refer to “Editing the Graph Attributes” later in this
chapter for details.
The Rms display presents the following test data:
ñ the total time of the selected range along the X axis.
ñ the minimum and maximum rms voltage values along the Y axis.