


Viewing Test Data - 5
45
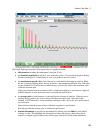
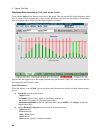
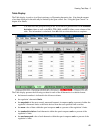
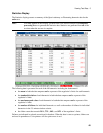
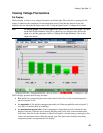
Statistics Display
The Statistics display presents a summary of the Quasi-stationary or Fluctuating harmonic data for the
entire test.
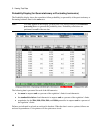
Note: If no data appears in this display, go back to the Test window and press the Run Post
processing button to generate the statistics data. Statistics are generated from all of the
test data when the test run is complete.
The following data is presented for each of the 40 harmonics including the fundamental:
ñ the mean in both absolute amperes and as a percent of the regulation’s limits for each harmonic.
ñ the standard deviation of each harmonic in both absolute amperes and as a percent of the
regulation’s limits.
ñ the maximum peak value of each harmonic in both absolute amperes and as a percent of the
regulation’s limits.
ñ the number of failures for individual harmonics as well as the number of failures for individual
harmonics in the 2.5 minute window criteria.
ñ the failure count that exceeds 50%, 75% , 90%, and 95% of the regulation’s limits.
Failures are indicated in red and are enclosed in brackets. When the data is sent to a printer, failures are
enclosed in parentheses. Color printers will also print errors in red.