


5 - Viewing Test Data
40
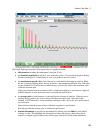
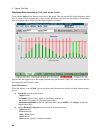
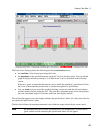
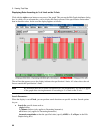
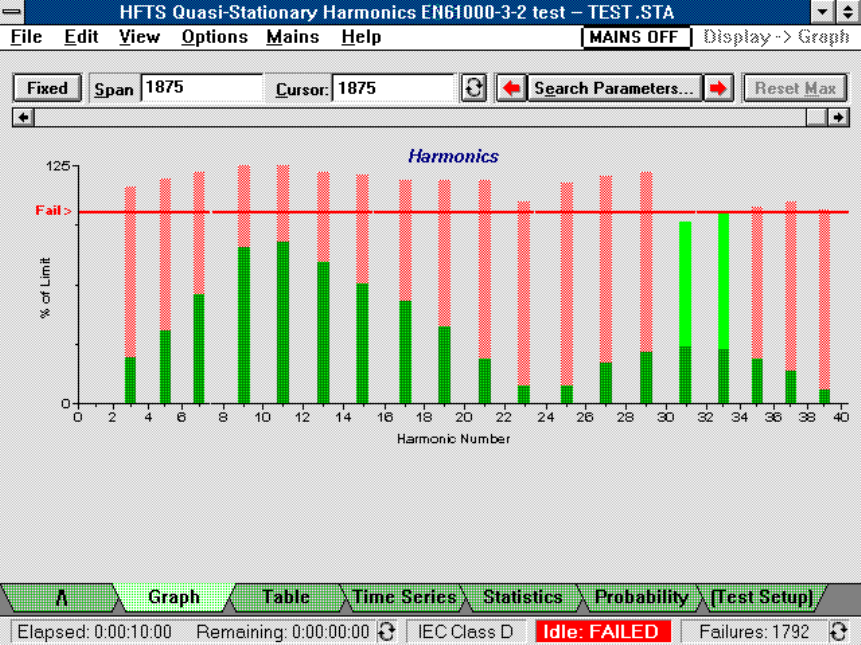
Displaying Data According to % of Limit on the Y-Axis
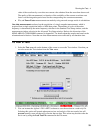
Click with the right mouse button on any area of the graph. This puts up the Edit Graph Attributes dialog
box, in which you can reformat the y axis to display the data in percent of the specification limits rather
than in absolute values. In this case the display appears as follows:
The red line that appears across the display indicates the specification’s limits. All values above the line
are outside the specification’s limits.
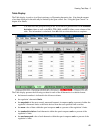
Search Parameters
When the display is set to Fixed, you can perform search functions on specific test data. Search options
let you
ñ Search for specific items such as:
single failures
2.5 minute failures (only applies to fluctuating harmonics)
all failures (only applies to fluctuating harmonics)
harmonic magnitudes > than the specified value (specify AMPS or % of Spec. in the Edit
Graphs dialog box)
ñ specify Harmonic Selection criteria for the following harmonics:
Odd harmonics
Even harmonics
Odd ≤ 19 harmonics
All harmonics
Nth harmonic (specify a harmonic number)