


5 - Viewing Test Data
50
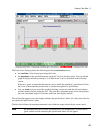
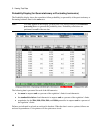
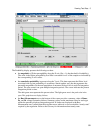
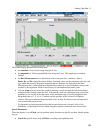
Light green indicates that the maximum value is within the regulation’s specification. Light red
indicates that one or more measured values are outside the regulation’s specification. The
maximum component percentiles are always light green, since no failure criteria is specified for
these by the regulation.
ñ the present value of each component is indicated by the solid part of each bar. When the test is
running (Rolling mode), this value is always the latest measured value. After the test has
finished, or if Fixed mode is selected during a running test, this value is the value at the present
cursor location within the selected span. The cursor indicates the presently displayed integration
period or test time.
Green indicates that the present value is within the regulation’s specification. Red indicates that
one or more measured values are outside the regulation’s specifications. The component
percentiles are always green, since no failure criteria is specified for these by the regulation.
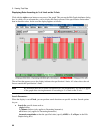
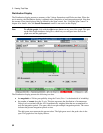
ñ detailed pst information can be obtained by holding down the Shift key and double-clicking on
the Pst bar. This puts up a dialog box which indicates the number of Pst failures in the selected
span, the Perceptibility Unit value at the present cursor location, and the minimum and maximum
Perceptibility Unit values in the selected span.
ñ the Rms Measurement area on the bottom of the screen provides a summary value of
Dmax, Dc, and Dt failures. Summary values are the maximum value for each type within the
presently displayed integration period. If dashes are displayed in the Rms Measurement area, it
means that the test either never achieved or never exited the “steady-state” required by the
regulation. Refer to the Glossary for information about steady-state.
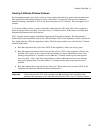
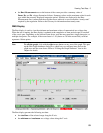
Search Parameters
When the display is set to Fixed, you can perform search functions on specific test data. Search options
let you:
ñ Search for specific summary items such as:
Pst according to perceptibility units
Dmax as a percent of the nominal voltage
Dc as a percent of the nominal voltage
Dt by time threshold (seconds).
You can specify searches by Failures, or by Magnitudes > than the specified value.
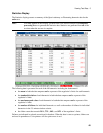
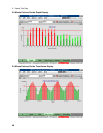
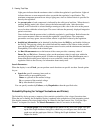
Probability Display (for Voltage Fluctuations and Flicker)
The Probability display presents a summary of the cumulative probability of the voltage fluctuations data.
When the test is running, the Probability display is updated at the completion of each integration period.
Note that the amount of test data displayed may be limited by the Span control. See “Using the Span
Control” in chapter 6 for details. The Search Parameters control is not active in this display.
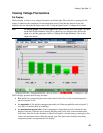
Note To edit the graph, click with the right mouse button on any area of the graph. This puts
up the Edit Graph Attributes dialog box, which lets you configure items such as the
graph axes and the graph span. Refer to “Editing the Graph Attributes” later in this
chapter for details.