


Celeron™ Processor Development Kit Manual
5-11
BIOS Quick Reference
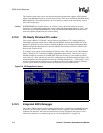
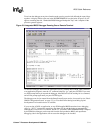
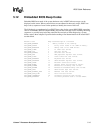
To activate the debugger at any time from the main console, press the left shift and the control keys
together. A display similar to the one in the HYPERTERMINAL session below (Figure 5-9) will
appear, containing the title, “Embedded BIOS Debugger Breakpoint Trap” and a snapshot of the
processor general registers.
To leave the debugger and resume the interrupted activity (whether POST, BIOS, DOS, Windows,
or an application program), enter the “G” command (short for “go”) and press ENTER. If you were
at a DOS prompt when you entered the debugger, then DOS will still be waiting for its command,
and will not prompt again until you press ENTER again.
The debugger can also be entered from the Setup Screen System, and as a boot activity (see “Basic
CMOS Configuration Screen” on page 5-3), as a last ditch effort during board bring-up and
development if no bootable device is available.
If your version of DOS, an application, or any OEM-supplied BIOS extensions have debugging
code (i.e., “INT 3” instructions) remaining, then these will invoke the debugger automatically,
although this is not an error. To continue, use the “G” command. When Embedded BIOS is adapted
by the OEM, the debugger can be removed from the final production BIOS, and superfluous
debugging code in the application will not cause the debugger to be invoked.
Figure 5-9. Integrated BIOS Debugger Running Over a Remote Terminal