20 Trends Viewing Trends
224
Viewing Graphic Trends
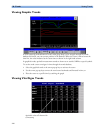
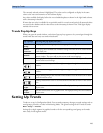
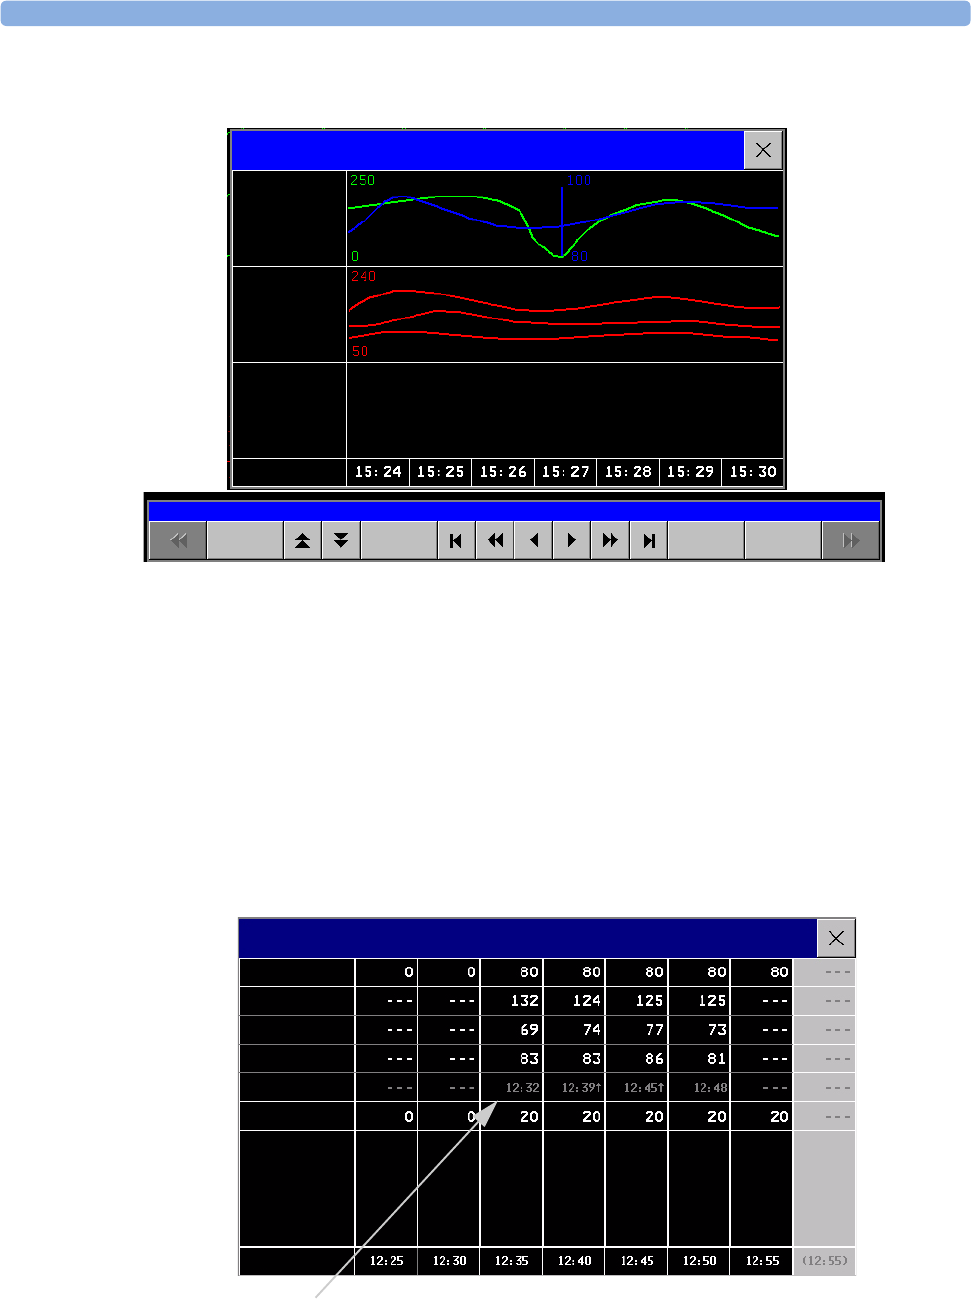
A cursor spanning all measurements in the trend group helps you to navigate through the trends
database and shows you your current position in the database. When the cursor is moved across the
time line, the values measured at the cursor time are shown in the right hand column.
In graphical trends, aperiodic measurement trends are shown as an asterisk, NBP has a special symbol.
To use the trend cursor to navigate in time through the trends database,
1 Select the graphical trend or the arrow pop-up keys to activate the cursor.
2 Use the arrow pop-up keys to move the trend cursor backwards and forwards in time, or
3 Place the cursor at a specific time by touching the graph.
Viewing Vital Signs Trends
Graphical Trends: All
Select
Group
Vital
Signs
Print
Select
Interva
Graphical Trends
HR
SpO2
ABP
9 Apr
Aperiodic values are shown with
a timestamp
Vital Signs: Standard
HR
NBPs
NBPd
NBPm
RR
20 Feb


