


OneTouch® Diabetes Management Software v2.3.1 User Manual 91
Table of Contents
| Index W Previous Next X
Table of Contents
| Index W Previous Next X 91
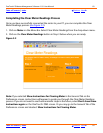
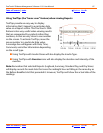
Colors and Shading in Reports
Several Reports use color, shading and typefaces to display data or to differentiate data when
viewing or printing Reports.
Viewing Reports:
■ The following reports use separate cell colors and bold type to highlight individual
readings that are outside the target ranges: Pie Chart, Logbook Report, Data List
Report, Summary Report, and the Day View screens.
■ Different cell colors are used for above target readings, below target readings, and
hypoglycemic readings. A legend that explains the meaning of the colors will appear
on every Report that has out-of-target readings.
■ Insulin doses that were transferred from a meter are highlighted in regular type. Doses
that were taken according to a OneTouch
®
DMS Regimen will appear in bold type.
■ Several Report graphs also show the Overall (Target) Range as a shaded gray band.
Printing Reports:
■ Reports may be printed in color or black and white.
•Color printing: Identical color schemes are used for viewing and printing
reports.
• Black and white printing: In the Logbook Report, the Data List Report,
the Summary Report, and Day View screens, out-of-target readings are
highlighted as bold italics. The Pie Chart Report uses fill patterns to differentiate
out-of-target and within-target breakdowns. A legend that explains the meaning
of the different fill patterns will appear on every Report that has out-of-target
readings.
■ The default setting for printing is color. To change this setting, deselect color print
from the File, Print Options menu.
■ The Overall (Target) Range will appear as horizontal dashed lines.
■ Insulin doses that were transferred from a meter are highlighted in regular type. Doses
that were taken according to a OneTouch
®
DMS Regimen will appear in bold type.