


OneTouch® Diabetes Management Software v2.3.1 User Manual 106
Table of Contents
| Index W Previous Next X
Table of Contents
| Index W Previous Next X 106
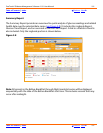
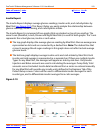
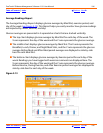
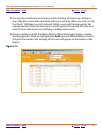
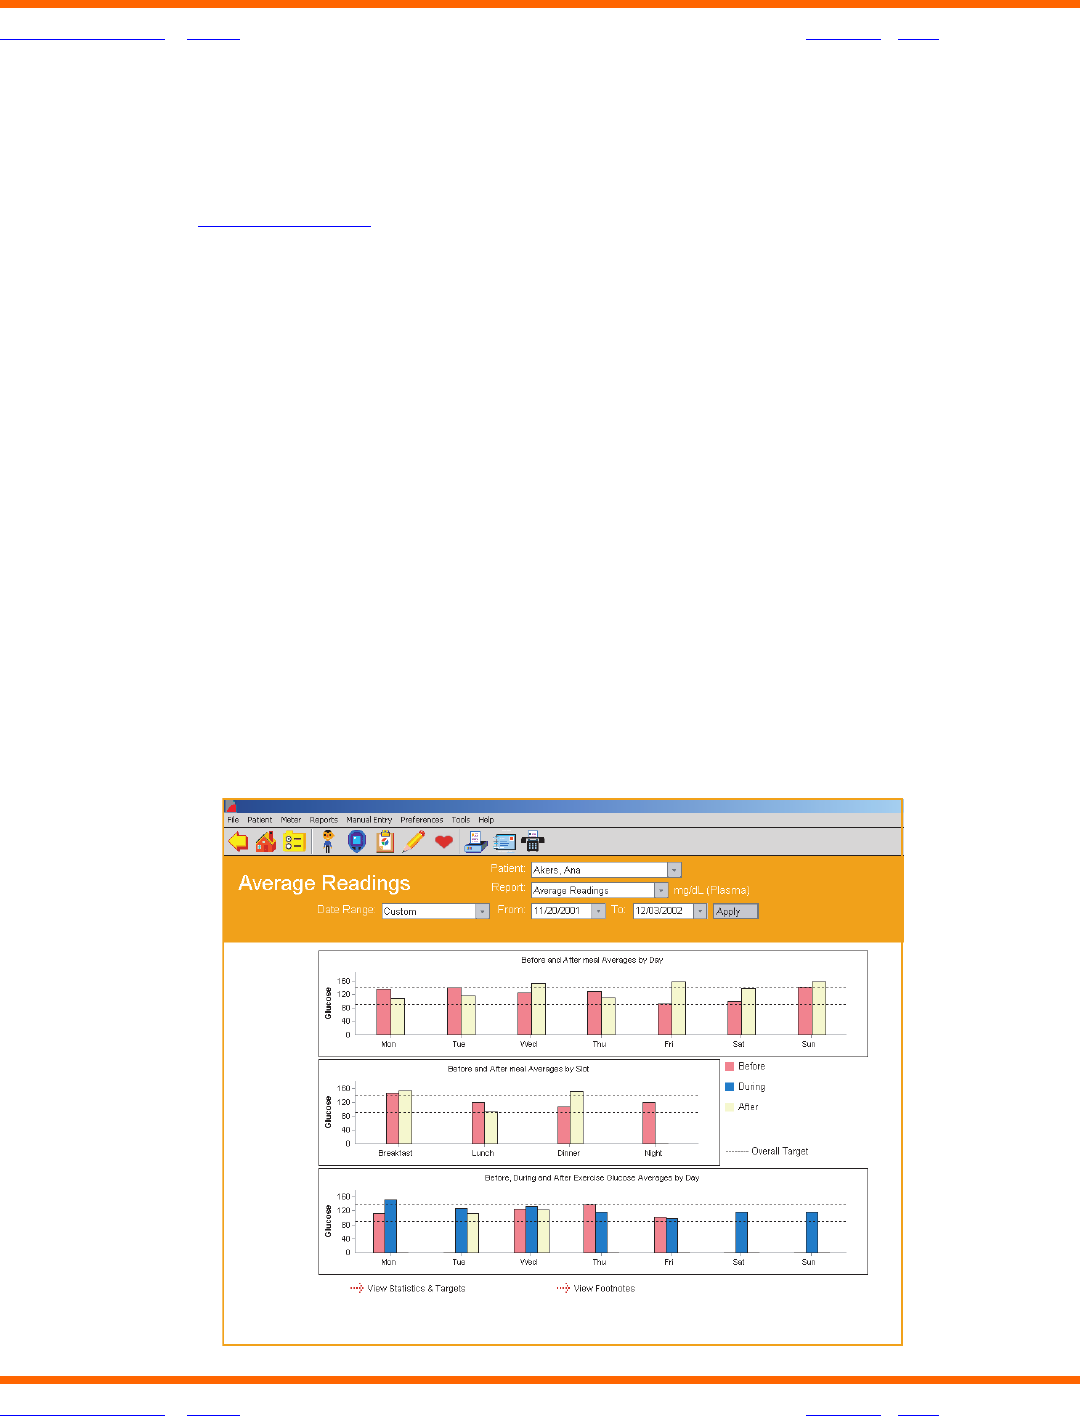
Average Readings Report
The Average Readings Report displays glucose averages by Meal Slot, exercise period, and
day of the week (see
Figure 3.13). This Report helps you easily monitor how glucose readings
are impacted by meals, exercise, and day.
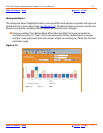
Glucose averages are presented in 3 separate bar charts that are stacked vertically.
■ The top chart displays glucose averages by Meal Slot for each day of the week. The
X-axis represents the day of the week and the Y-axis represents the glucose average.
■ The middle chart displays glucose averages by Meal Slot. The X-axis represents the
Breakfast, Lunch, Dinner, and Night Meal Slots, and the Y-axis represents the glucose
average. Before-Meal and After-Meal period averages are displayed as side-by-side
bars for each Meal Slot.
■ The bottom chart displays glucose averages by Exercise period for each day of the
week. Readings you have tagged with exercise comments are displayed here. The
X-axis represents the day of the week and the Y-axis represents the glucose average.
Before Exercise, During Exercise, and After Exercise period averages are displayed as
side-by-side bars for each day of the week.
Figure 3.13