


OneTouch® Diabetes Management Software v2.3.1 User Manual 111
Table of Contents
| Index W Previous Next X
Table of Contents
| Index W Previous Next X 111
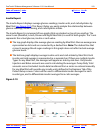
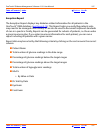
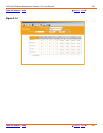
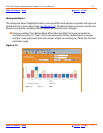
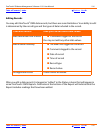
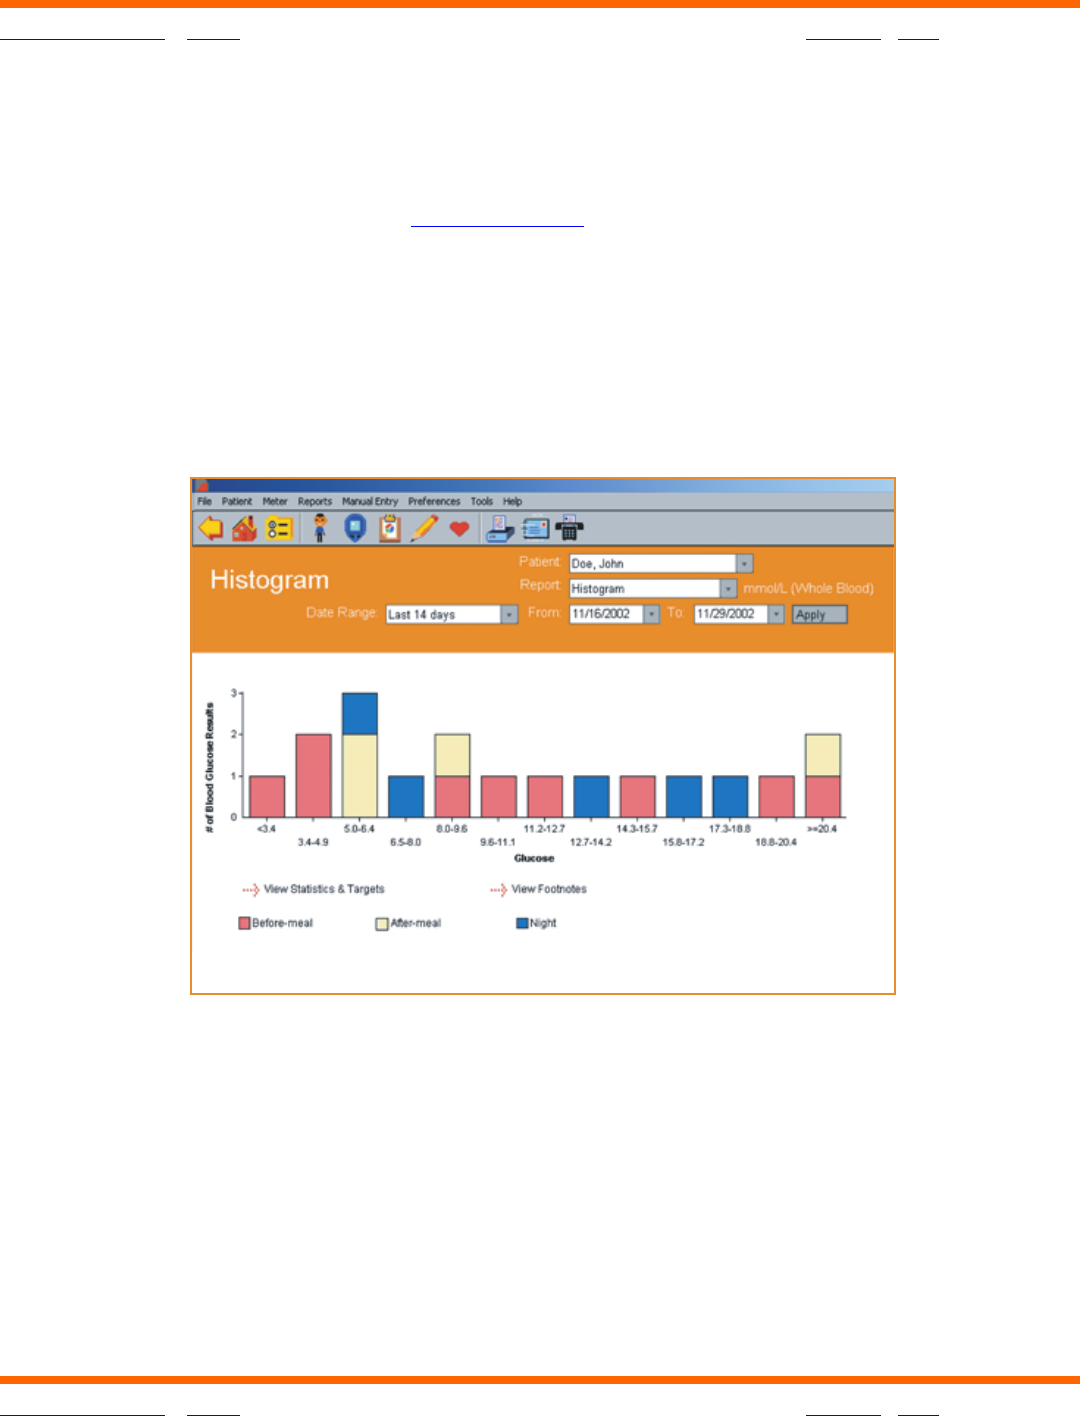
Histogram Report
The Histogram Report highlights before-meal and after-meal patterns together with glucose
distribution for a given date range (see
Figure 3.16). This Report helps you easily monitor the
frequency of glucose readings that fall within and outside a set of ranges.
■ Glucose readings from Before-Meal, After-Meal and Night slots are presented as
stacked bars on an X-Y chart. The X-axis represents the pre-defined glucose ranges
and the Y-axis represents the total number of glucose readings in a Meal Slot, for that
particular range.
Figure 3.16