


OneTouch® Diabetes Management Software v2.3.1 User Manual 102
Table of Contents
| Index W Previous Next X
Table of Contents
| Index W Previous Next X 102
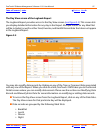
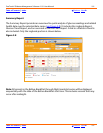
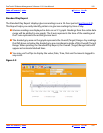
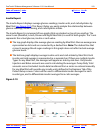
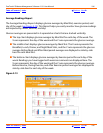
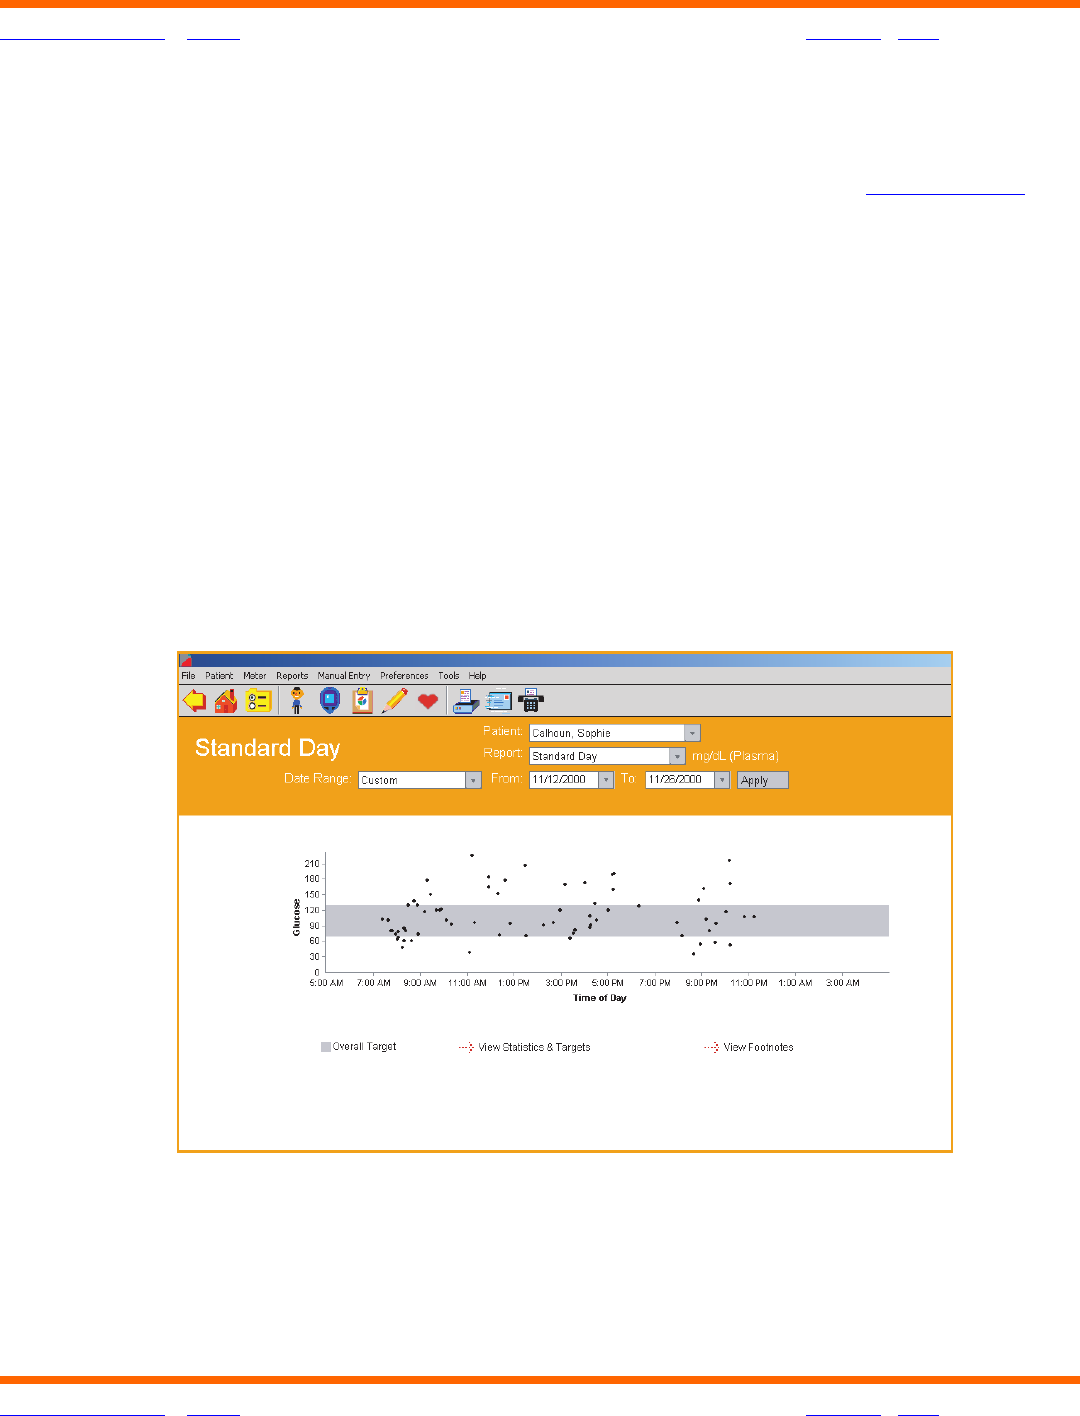
Standard Day Report
The Standard Day Report displays glucose readings over a 24-hour period (see Figure 3.9).
This Report helps you easily identify patterns in glucose readings by time of day.
■ Glucose readings are displayed as dots on an X-Y graph. Readings from the entire date
range will be plotted in one graph. The X-axis represents the time of the reading and
the Y-axis represents the actual glucose level.
■ The shaded gray area on the graph represents the Overall (Target) Range. Any readings
that fall above or below the shaded gray are considered outside of this Overall (Target)
Range. When printing the Standard Day Report, the Overall (Target) Range limits will
appear as horizontal dashed lines.
■ You may use ToolTips to display the value, Date, Time, Slot and Comments tagged to
any result.
Figure 3.9