


OneTouch® Diabetes Management Software v2.3.1 User Manual 100
Table of Contents
| Index W Previous Next X
Table of Contents
| Index W Previous Next X 100
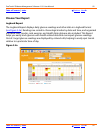
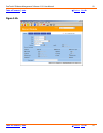
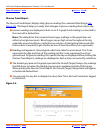
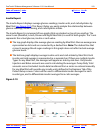
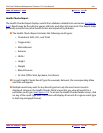
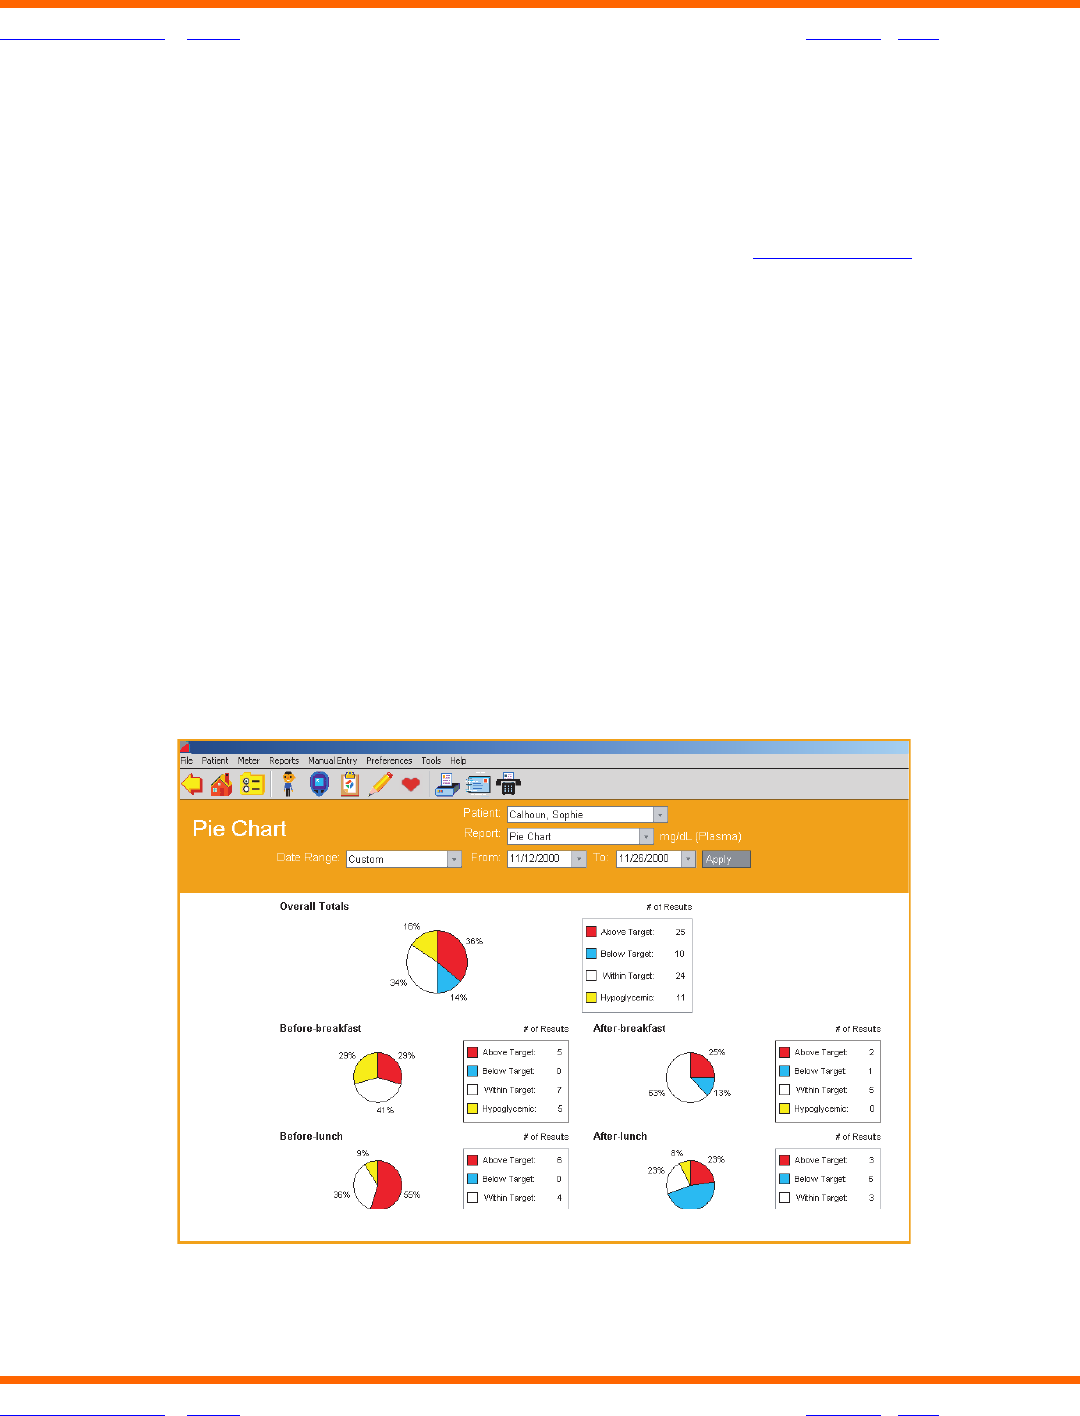
Pie Chart Report
The Pie Chart Report displays the percentage of glucose readings that fall above, below and
within each Before-Meal and After-Meal target range. This Report helps you easily see how
glucose readings compare with target ranges for each Meal Slot (see
Figure 3.7).
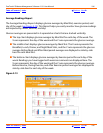
■ A total of eight pie charts will appear in the Report. These represent the Before-Meal
and After-Meal breakdowns for each Meal Slot , one for Night and one for Overall
Target Range.
■ Pie charts for each Before-Meal and After-Meal pairing will appear side by side. This
helps you scan for trends within a particular Meal Slot.
■ Chart pairings are also stacked vertically so you can compare Before-Meal percentages
and After-Meal percentages across all Meal Slots.
■ The Pie Chart Report uses applicable Before-Meal and After-Meal target ranges to
display an Overall Total range. The Overall Total pie chart provides the percentage
breakdowns using all glucose readings within and outside the Overall (Target) Range.
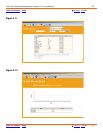
Figure 3.7