


OneTouch® Diabetes Management Software v2.3.1 User Manual 103
Table of Contents
| Index W Previous Next X
Table of Contents
| Index W Previous Next X 103
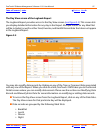
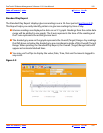
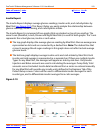
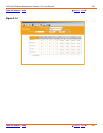
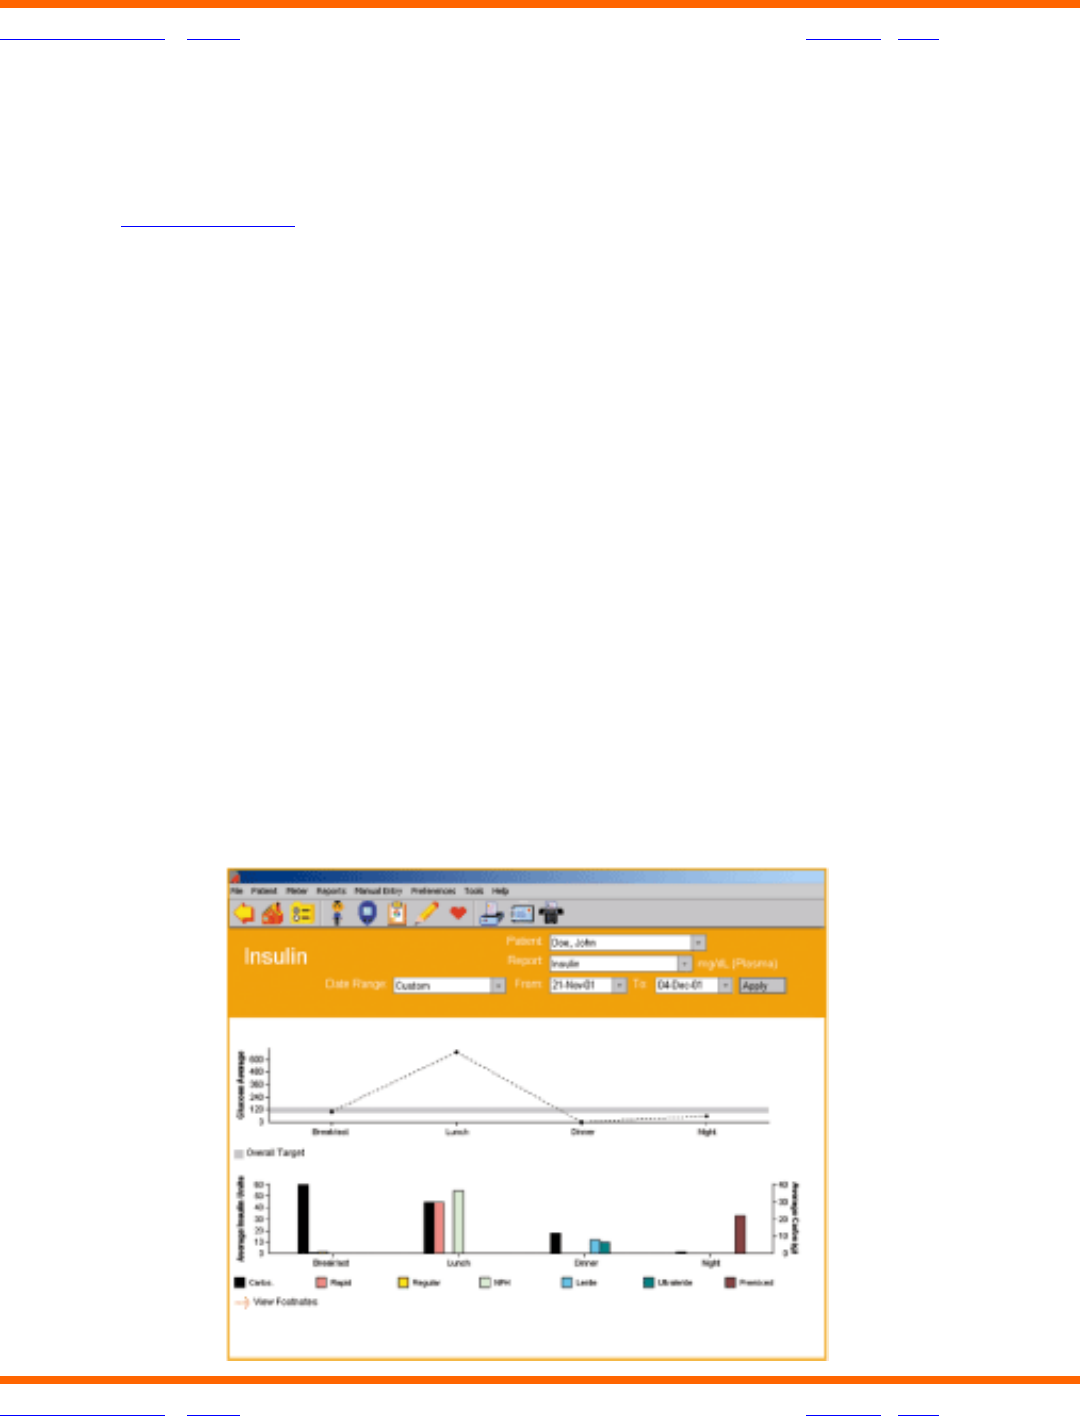
Insulin Report
The Insulin Report displays average glucose readings, insulin units, and carbohydrates by
Meal Slot (see
Figure 3.10). This Report helps you easily analyze the relationship between
glucose readings, insulin dosing, and carbohydrate intake.
The Insulin Report is composed of two graphs that are stacked on top of one another. The
same X-axis (Breakfast, Lunch, Dinner and Night Meal Slots) is used for both graphs. The Y-axis
represents the actual glucose, insulin or carb value.
■ The top graph displays the average glucose reading by Meal Slot. Glucose averages are
represented as dots and are connected by a dashed line. Note: The dashed line that
connects average blood sugar readings in this graph does not reflect actual average
glucose levels.
■ The bottom graph displays average insulin units and carb intake by Meal Slot. Each
insulin and carb average is represented as a separate bar. If there are multiple Insulin
Types for any Meal Slot, the averages will appear as side-by-side bars. Only Insulin
Injection and Bolus amounts are used in calculating the averages. Pump Daily Total
amounts are not included. Insulin data transferred from a meter or entered manually
for any Meal Slot will override any insulin units defined in the Regimen Tab of the
Patient Setup screen. Colors will be used to differentiate insulin averages for each
insulin type, and to differentiate insulin averages from carb averages.
Figure 3.10