


Viewing Process Values and Changing Setpoint
6-3
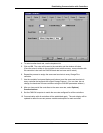
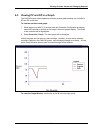
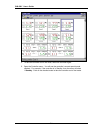
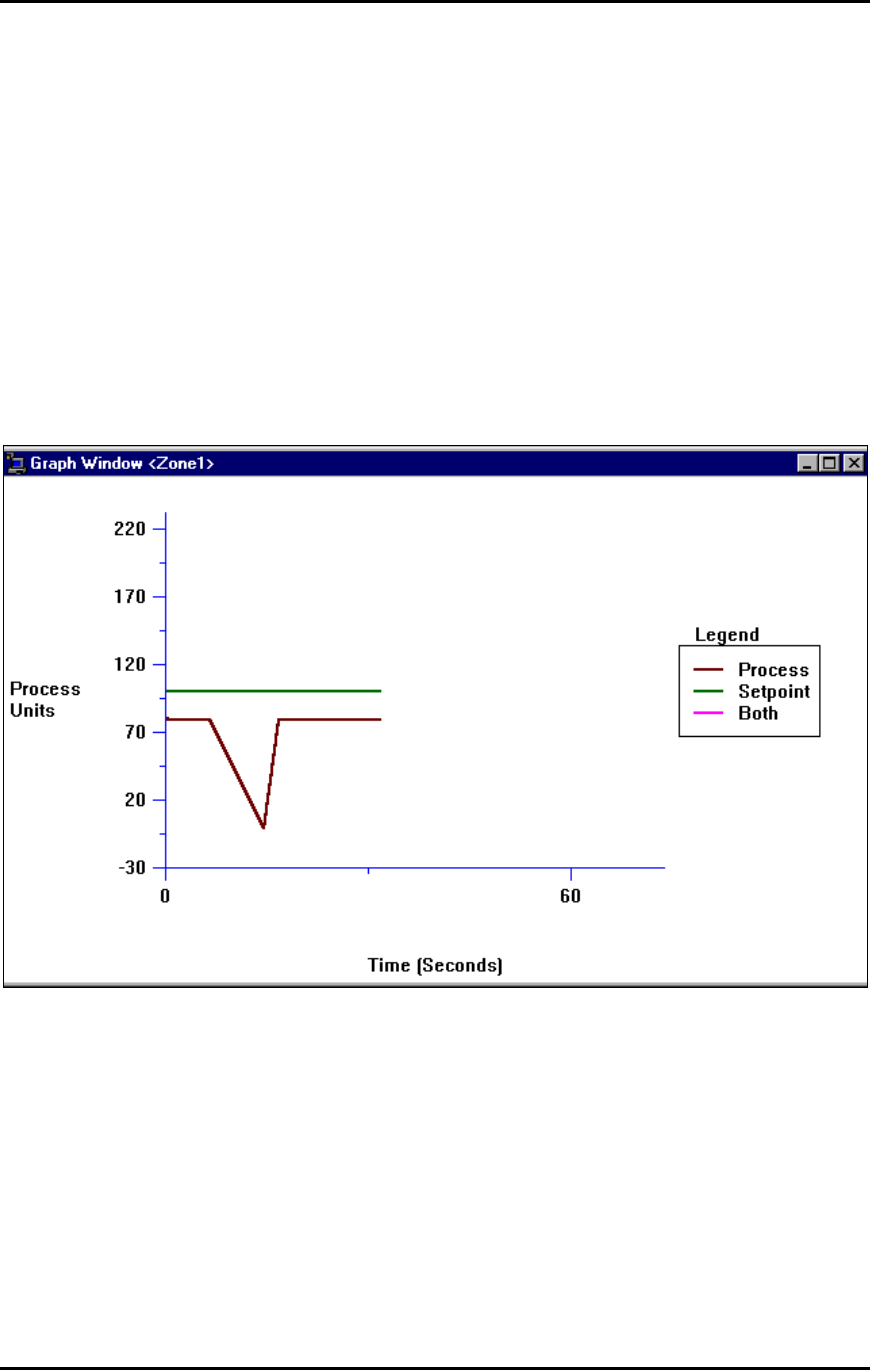
6.3 Viewing PV and SP in a Graph
The CN8-SW system allows operators to display a trend graph showing any controllerÕs
SP and PV in real-time.
To view the real-time trend graph:
1. While logged in as MULTI (or another user with Controller Configuration privileges),
select the controller by clicking on its image in the main graphic display. The border
of the controller will be highlighted.
2. Select Controller | Graph. The trend graph will be displayed.
Initially the graph will not show any trend tracings. However, as soon as the selected
controller is polled by the CN8-SW system, trend tracings will begin to be drawn. As long
as the Graph Window remains open, the trend tracings will be updated.
To close the Graph Window, double-click on the X in the top right corner.