


Operating Instructions
760A / 760D / 760N
2–7
760A When a ppm such as the 760A is used in conjunction with vu meters. it is
important to consider the difference in dynamic characteristics when aligning
system levels. The vu meter is an average reading meter with a relatively long
integration time. Its slow response causes it to indicate between 6 and 15 dB
below actual audio peaks, depending on program content. The ppm is a
quasi–peak meter with a short (but not instantaneous) attack time and very slow
decay. It reads much closer to actual audio peaks, within 3 to 6 dB. So when
lining up a system with a test tone, the ppm must read lower than the vu meter to
make them read the same on program audio. Broadcast authorities have found
that 8 dB is a good average difference between peak–to–reading ratio of the ppm
and vu meter. Hence, they have specified that a line–up tone reading of 0 vu on
the vu meter should read –8 dB on the ppm. With this alignment, both meters
will read substantially the same with audio program material, with the ppm
giving more reliable control of program peak levels. The input sensitivity of the
760A is set using internal jumpers. See SECTION 3 INSTALLATION for details.
760D The Alignment Signal Level should indicate –9 dB on either the normal
(white) or the expanded (blue) scale. The two scales coincide at the –9 dB
“arrowhead” marks. Very accurate level settings can be achieved using the blue
expanded scale, activated by pressing and holding the EXPAND SCALE button
760N System alignment is done at the 0 dB TEST level. Both the normal (white)
and the expanded (blue) scales coincide at the TEST mark. Very accurate level
settings can be achieved using the blue expanded scale, activated by pressing and
holding the EXPAND SCALE button.
NOTE. Perform the preceding alignment procedure before making any measure-
ments, to ensure accurate results.
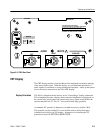
Phase difference between LEFT and RIGHT sine waves of the same frequency
can be measured with the phase marks on the CRT graticule. The signals need
not have the same amplitude, though the measurement is easier if they are
approximately equal.
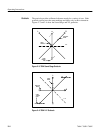
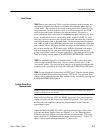
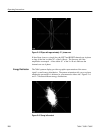
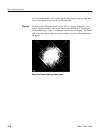
Adjust the MANual DISPLAY GAIN control to make the edges of the ellipse
just touch the Phase Tangent Lines (see Figure 2–3 or 2–4). Read the phase
difference where the ellipse crosses the axis with the phase marks. The longer
marks represent 10° increments and the shorter ones represent 5°. Figure 2–5
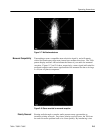
shows a stereo signal with approximately 13° phase error.
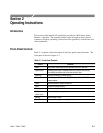
Level Setups
System Phase Error
Measurements