


Chapter 6 Customizing the software 79
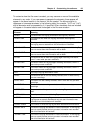
Charts
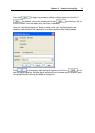
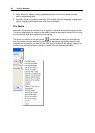
The Charts options allow the various aspects of the charts that display the readings
recorded by LogTags to be customized. At the base of the Window is a color selector and
other relevant controls, which apply to the highlighted item on the list in the window.
Some experimentation with these settings will show very quickly how they work. Select a
color in the color panel, click
, and then go to the Data screen to see the
results of the change.
Note that the three regions on the chart display can be controlled. LogTags can be
configured to detect over and under conditions based on a series of temperature and/or
humidity measurements. When the data is displayed graphically on the chart, these
become color background regions. These are different colors for "above high alert limit",
"between high alert limit and low alert limit" and "below low alert limit". This allows out-
of-range and in-range data to be spotted easily on the listed or charted data.
By selecting a line style for the "above high alert limit" and "below low alert limit" regions
you can improve the readability of the charts on black and white printouts.
Most of these settings can also be enabled or disabled by clicking the tick box for the
relevant item in the list.