


66 LogTag Analyzer
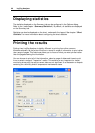
Displaying statistics
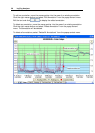
The statistics displayed on the Summary tab can be configured in the Options dialog.
Refer to the (see chapter “
Summary Statistics
”). By default, all statistics are displayed
on the Summary tab.
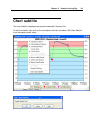
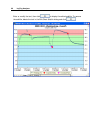
Statistics can also be displayed on the chart, underneath the legend. See chapter
“Chart
Statistic
s” for more information about configuring the chart statistics
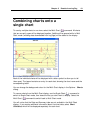
Printing the results
Printing from LogTag Analyzer is slightly different to printing from other common
Windows software, as the printer functions in terms of range of information to print rather
than range of pages. This technique allows you to focus on what you want printed rather
than the pages showing the information.
You can choose to print all of the information, select a range of dates and times to print
from or select a range of "inspection" marks. This could be a very important for transit
monitoring since post trip and pre-event data are not significant to a discussion or dispute
centering on a humidity and/or temperature maintenance issue.