


Chapter 5 Results from LogTag 53
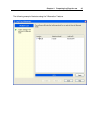
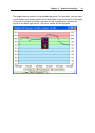
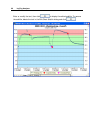
This display now shows the maximum detail from the highlighted area.
When this mouse operation has been completed, for example, a picture of the highlighted
area can be placed on the clipboard. This picture can be then be pasted into any Microsoft
Windows
®
application. For example, if you are writing a letter and want to illustrate a
point based on chart data from a LogTag, you can paste the picture of the chart directly
into the letter.
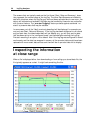
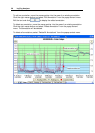
When the mouse pointer is moved over the chart, a small window (tooltip) is displayed
near the mouse pointer. It displays the reading closest to the mouse pointer position. If
the readings are very close together, it is a good idea to zoom in to an area of interest to
inspect individual readings with the help of tooltips.
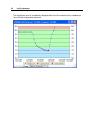
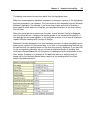
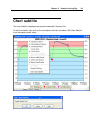
Whenever the data displayed on the chart has been zoomed in to show more detail and is
showing only a portion of the charted data, if you click on the corresponding Data tab you
will see that only the readings shown on the chart are currently displayed. If you also click
on the corresponding Summary tab you will see an additional section of statistics that
have been calculated based on only the portion of readings currently being shown on the
Chart screen. Following is an example of the additional section of statistics that will
appear within the Summary Screen when a section of the readings within the Chart
screen have been zoomed in.