


Chapter 5 Results from LogTag 55
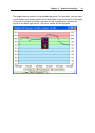
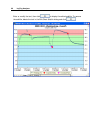
Manual scaling of the
chart
By default, each chart is initially displayed zoomed to the range of readings. This setting
can be changed in the Options dialog (see chapter “
Charts
”).
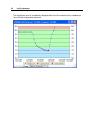
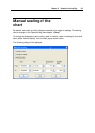
To change the temperature and humidity scale, or select a range of readings by time and
date, select “Manual Scaling” from the chart popup context menu.
The following dialog will be displayed: