


107
GLUCOSE ANALYSIS
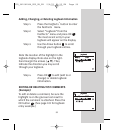
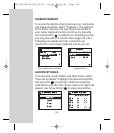
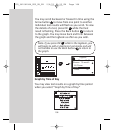
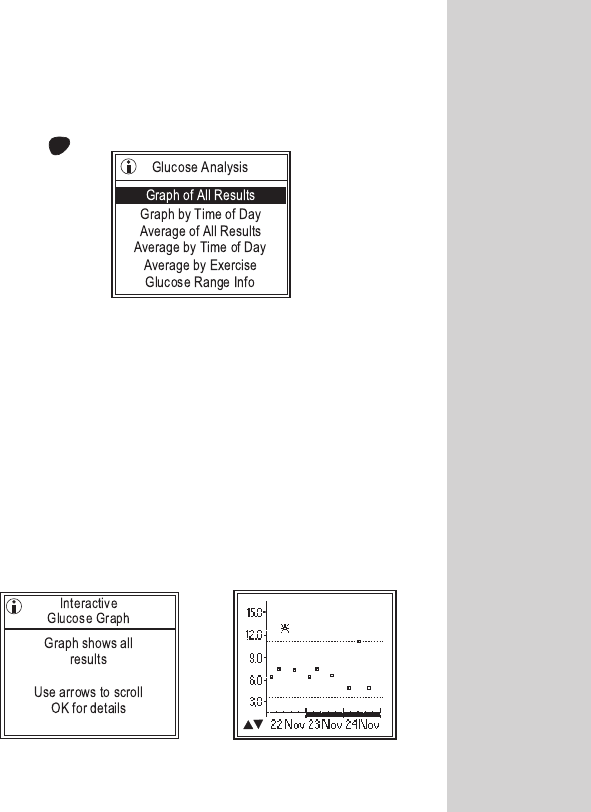
When you select “Glucose Analysis” on the FastFacts
™
menu, an additional menu of choices appears. Use
the Arrow button to move to the desired menu and
press OK .
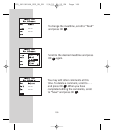
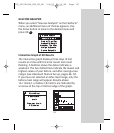
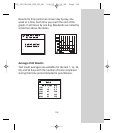
Interactive Graph of All Results
The interactive graph displays three days of test
results at a time with the most recent test result
flashing. A bold bar above the dates indicates a
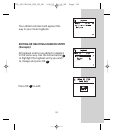
weekend. The two dotted lines indicate the lowest and
highest values of your before- and after-meal glucose
ranges (see Advanced Feature Set-up, pages 68–72).
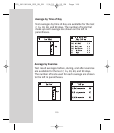
If you have not selected an after-meal range, only the
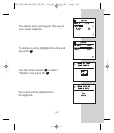
before-meal range will appear. Results above
16.7 mmol/L or below 2.8 mmol/L are indicated by
an arrow at the top or bottom edge of the graph.
OK
DCO_06158108A_OUS_OB_GB 5/6/03 1:25 PM Page 107