


Net Oil Computer Supplement 47
Operation Mode – NOC
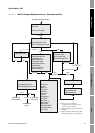
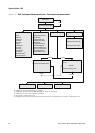
Troubleshooting IndexSeries 3000 MenusNOC Operation
5.2.3 Time periods for average, minimum, maximum, and total values
For the current test, running average, minimum, maximum, and total values for each process variable
are calculated from the beginning of the test. When the well test is stopped, the final values will be
stored with the test data.
5.2.4 Other activity during a well test
Between well tests, you can use the Exit button to move between the Well Performance Measurement
menu and the View menu. While a well test is in progress, you can use the Exit button on the Return
to Well Test screen to move between the well test screens and the View menu.
From the View menu, you can perform any available actions.
At any point from the well test screens, including during a well test, you can press the Security button
to access the Configuration and Maintenance menus. The system does not prevent configuration
changes, calibrations, or other procedures. However, many actions (e.g., reconfiguring well data) will
cause discontinuities in the well test data, and many procedures will interfere with data collection. If
you need to change system configuration or perform a maintenance procedure:
1. Stop the well test.
2. Make the required configuration changes or perform the required procedures.
3. Start a new well test.
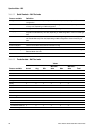
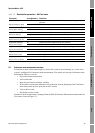
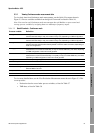
Test times
Test started Timestamp
Test time elapsed Hours and minutes
Transient bubble time Hours and minutes
Water cut overrange Hours and minutes
Transient mist time Hours and minutes
Table 5-4 TMR data – Well Test mode
Process variable Definition
Mass flow rate Current mass flow rate from the gas meter
2-phase mass total Total mass of liquid and gas in the gas stream during all TMR intervals
TMR mass total Calculated mass of gas in the gas stream during all TMR intervals
Mass carry-over Total mass of liquid in the gas stream during all TMR intervals (2-phase mass total minus TMR
mass total)
Oil volume carry-over Volume of oil in gas stream during all TMR intervals
Water volume carry-over Volume of water in gas stream during all TMR intervals
Transient mist time Hours and minutes that TMR has been active
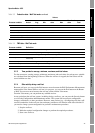
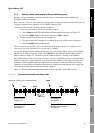
Table 5-3 Production data – Well Test mode continued
Process variable
Values
Actual Avg Min
Min time /
date Max
Max time /
date Total