Viewing ST Maps 6 ECG, Arrhythmia, and ST Monitoring
123
If an ST lead is switched off, its axis is not shown in the map.
If a lead is in INOP (the value is being measured but is invalid or unavailable because, for example, the
corresponding ECG electrode is unplugged), the area formed by the remaining ST leads is left open.
Trend View
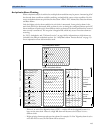
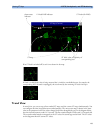
In trend view, you can see up to four trended ST maps, and the current ST map, simultaneously. You
can configure the time interval between trended samples. The most recent map is shown in the same
color as the parameter itself. Past values change from white through dark gray. In the diagram below,
the time interval between trends is 12 seconds. The first trended sample is white and is 12 seconds old.
The second trended sample corresponds to the ST values 24 seconds ago and so forth. The ST values
on the diagrams show the current ST values.
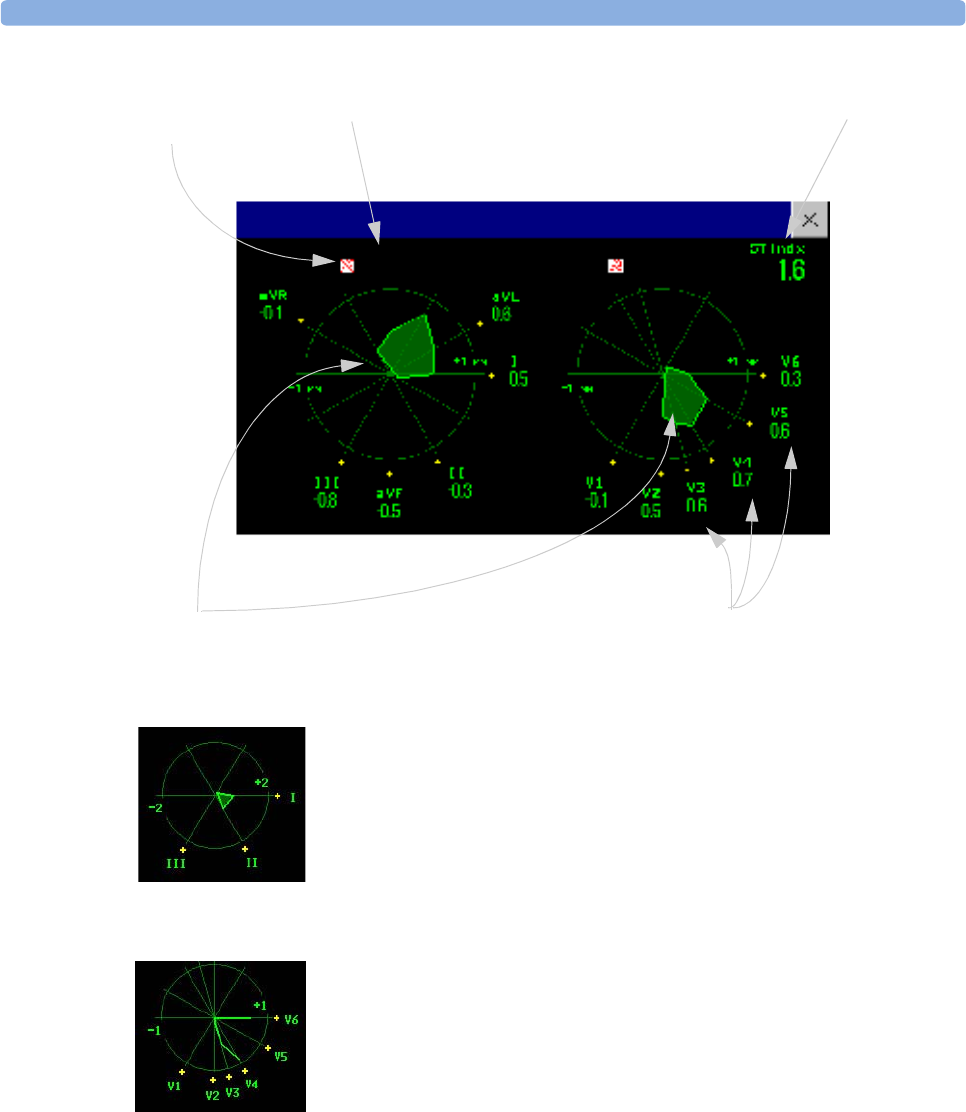
ST map
ST index (for EASI)12-Lead EASI indicator alarm status
indicator
EASI Limb leads EASI Chest Leads
ST label, value and polarity of
corresponding lead
ST Map (Current)


