6 ECG, Arrhythmia, and ST Monitoring ST Alarms
122
5
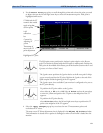
To update the ST snippet shown in the Adjust ST Points window, select the Update pop-up
key.
ST Alarms
ST alarms are yellow alarms. Each ST lead has its own alarm limit. ST alarms are triggered when an ST
value exceeds its alarm limit for more than one minute. Switching ST alarms off switches off alarms for
all ST leads.
If more than one ST measurement is in alarm, the monitor only displays the alarm message of the ST
lead which is currently furthest from its set alarm limits.
Single- or Multi-lead ST Alarming
Be aware that if multi-lead ST alarming is switched on, only alarms involving more than one ST lead
will be announced.
To choose individual or multi-lead ST alarming,
♦ In the Setup ST Analysis menu, select ST Alarm Mode and select either Single ST or
Multi ST.
Changing ST Alarm Limits
The monitor can detect alarms on each ST lead separately, so you can set high and low ST alarm limits
individually for each ST lead. You can also set separate alarm limits for single-lead and multi-lead ST
monitoring. Set the high and low alarm limits based on your assessment of the patient's clinical
condition, unit protocols, physician orders or medication specified limits. A good guideline is + 1.0
mm or - 1.0 mm from the patients's ST, or follow your hospital protocol.
1 In the Setup ST Analysis menu, select ST Alarm Mode and select Single ST or
Multi ST.
2 Select the alarm to be adjusted.
3 Select the appropriate setting.
Viewing ST Maps
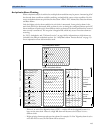
The monitor can derive a multi-axis portrait (map) from the ST analysis to help you detect changes in
ST values. It displays two planes obtained from a multilead ECG in a multi-axis diagram, where each
axis represents a lead. The ST value at the J point is given. The position of the axes within the diagram
correspond to the placement of the ECG leads. Each ST value is assigned to either a limb lead, or to a
chest lead. Every axis shows the polarity of the lead it represents. By joining adjacent ST values, the
monitor obtains the ST map. The contour line, and the map shading, is shown in the same color as the
ECG parameter.
Current View
In current view, the monitor displays an ST map that corresponds to the current ST values. Three or
more leads per plane are necessary to display a map.
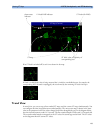
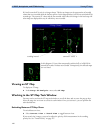
The left of the following diagram shows leads I, II, III, aVR, aVL, and aVF on the limb leads. On the
right, the V-leads (V1, V2, V3, V4, V5, and V6) are on the chest leads.


