Reference
WFM 601A, WFM 601E & WFM 601M User Manual
3–55
Vector Timing Measurements. In the composite domain, the transitions between
the vector end points display timing differences. But, because these timing
differences include the delay in the decoder output filtering, you can usually
ignore them. In the component domain there is no decoding required and
therefore the color bar transitions contain useful timing information. These
timing differences appear as looping or bowing of the transitions. It is possible to
measure the amount of bowing and convert the results to a coarse delay value. If
the transition looping appears large, use the Lightning display to measure the
interchannel delay.
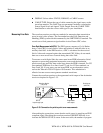
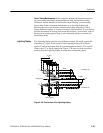
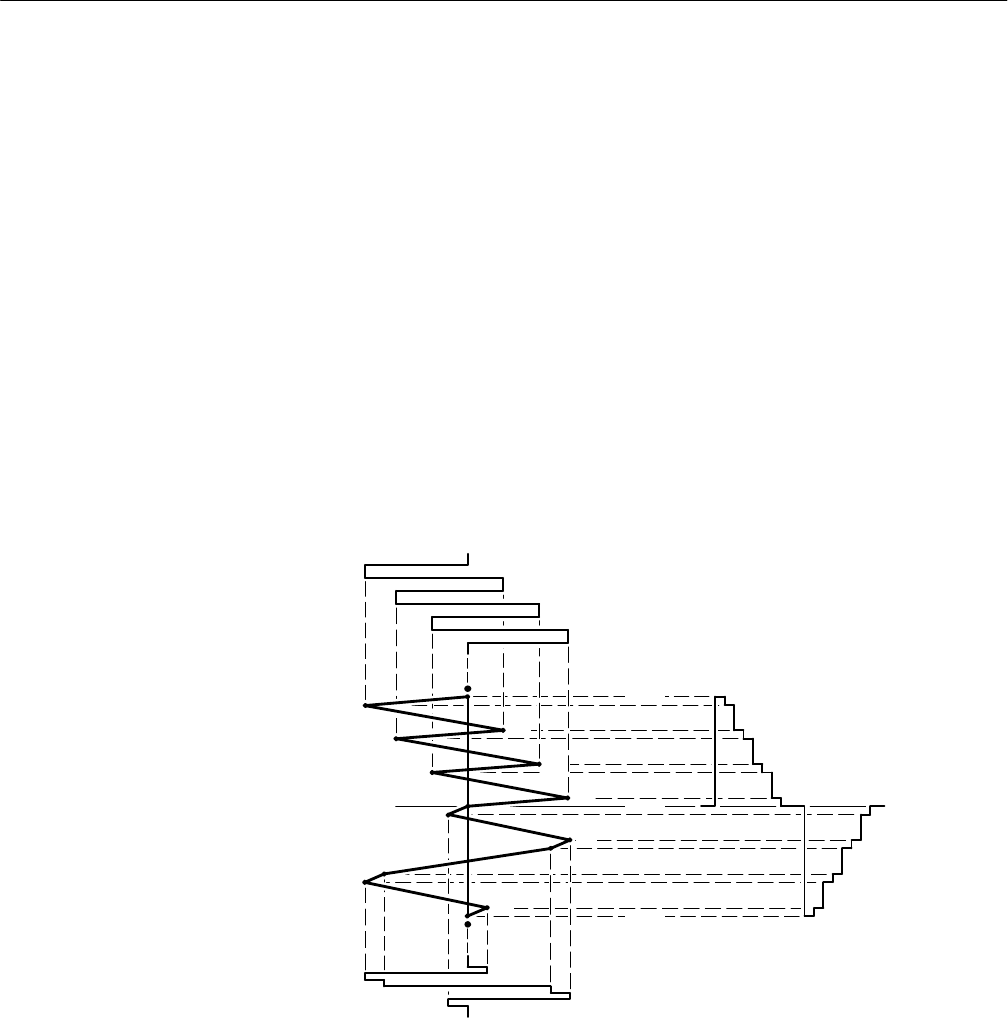
The Lightning display plots the color difference signals, Pb and Pr, against the
luminance (Y) signal. In the top half of the Lightning display, Pb is plotted
against Y, and on the bottom half, Pr is plotted against inverted Y. The vertical
center is the 0 V or black-clamp point. Figure 3–38 shows how the waveform
monitor plots the Lightning display from the three component signals.
P
r
(R-Y) signal
P
B
(B-Y)
CY
M
B
R
M
Y
L
CY
G
B
R
G
Clamp point 0V
Y signal
+ Luminance (Y)
– Luminance (Y)
Y
L
Black
White
White
Figure 3–38: Construction of the Lightning display
Lightning Display


