


Instruction Manual
IM-106-4050 Original Issue
March 2006
3-9
OxyBalance Oxygen Display
and Averaging System
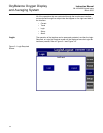
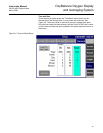
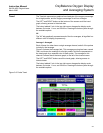
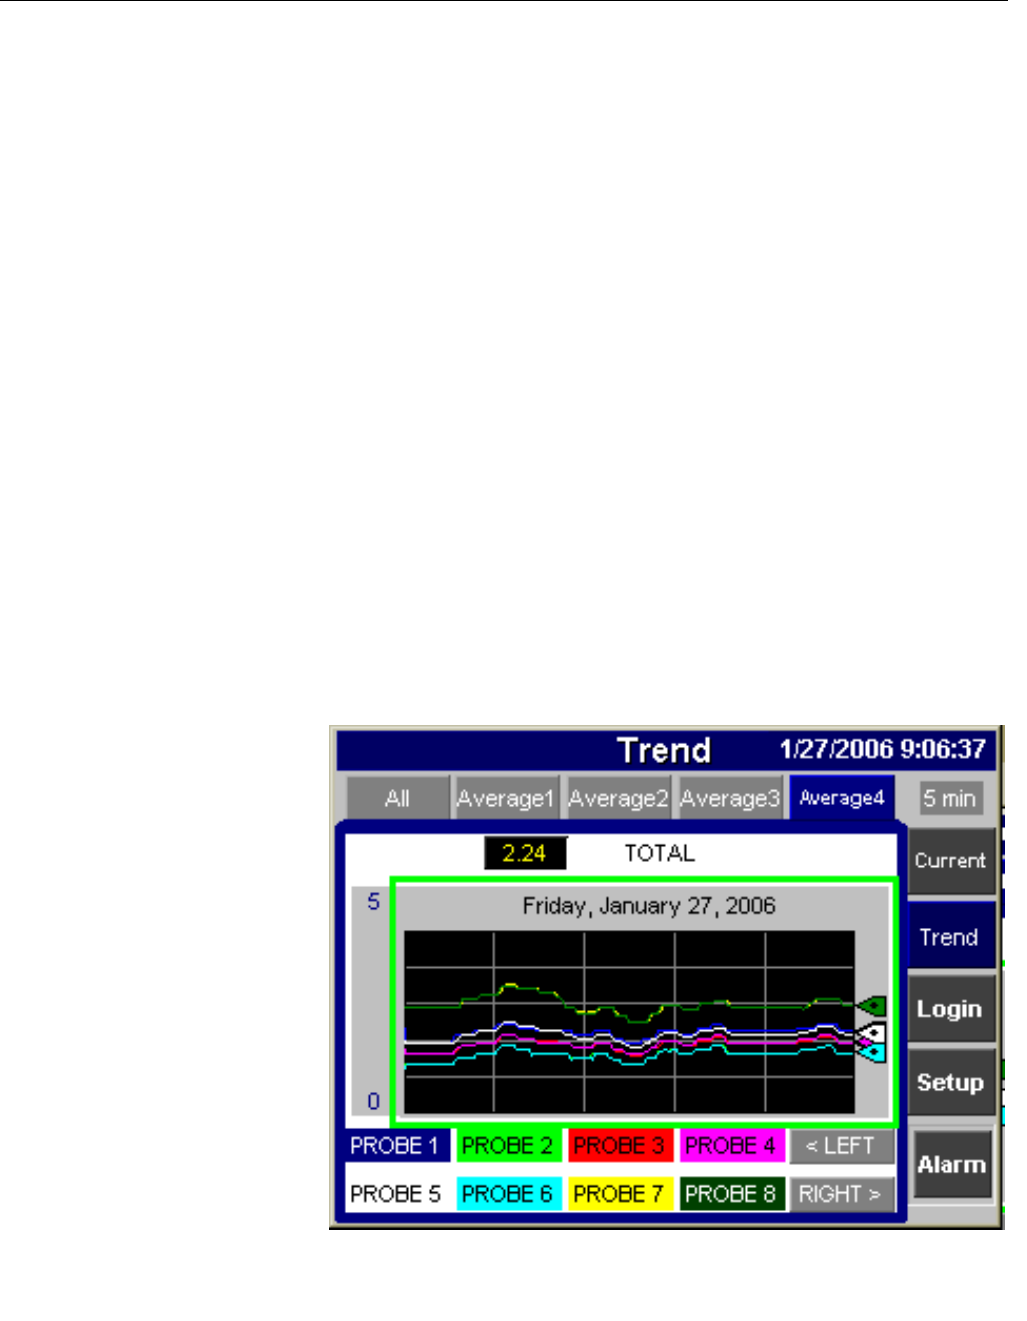
Trend The Trend tab represents a graphical trend analysis of the oxygen percentage
for all eight probes, and the oxygen percentage for all four averages.
The LEFT and RIGHT buttons at the bottom of the screen scroll the trend
graph, allowing access to historical data.
The button labeled 5 min in the top right corner changes the display scale
between 5 minutes, 1 hour, and 24 hours. Pressing the button cycles through
the available options.
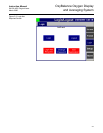
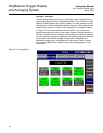
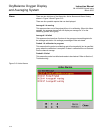
All
The "All" tab graphically represents each of the four averages, all signified in a
different color for display purposes only.
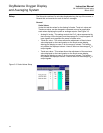
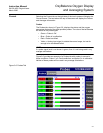
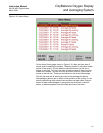
Average1- Average4
Each of these four tabs shows a single average channel, and all of the probes
included in that average.
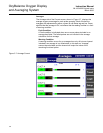
Figure 3-8 shows the Average4 tab. This average grouping has been named
Total, and shows the readings for all eight probes, which are represented on
the trend graph by a separate color for each probe. The average for this
channel is shown above the trend graph, to the left of the channel name.
The LEFT and RIGHT buttons scroll the trend graph, allowing access to
historical data.
The button labeled 5 min in the top right corner changes the display scale
between 5 minutes, 1 hour, and 24 hours. Pressing the button cycles through
the available options.
Figure 3-8. Probe Trend