3-4
Instruction Manual
IM-106-4050 Original Issue
March 2006
OxyBalance Oxygen Display
and Averaging System
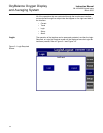
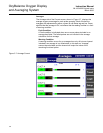
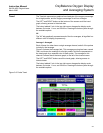
Setup The Setup tab continas five sub-tabs displayed along the top of the screen; a
General tab, and one tab for each of the four averages.
General
Scale Values
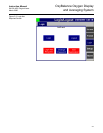
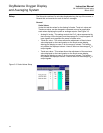
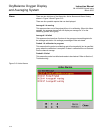
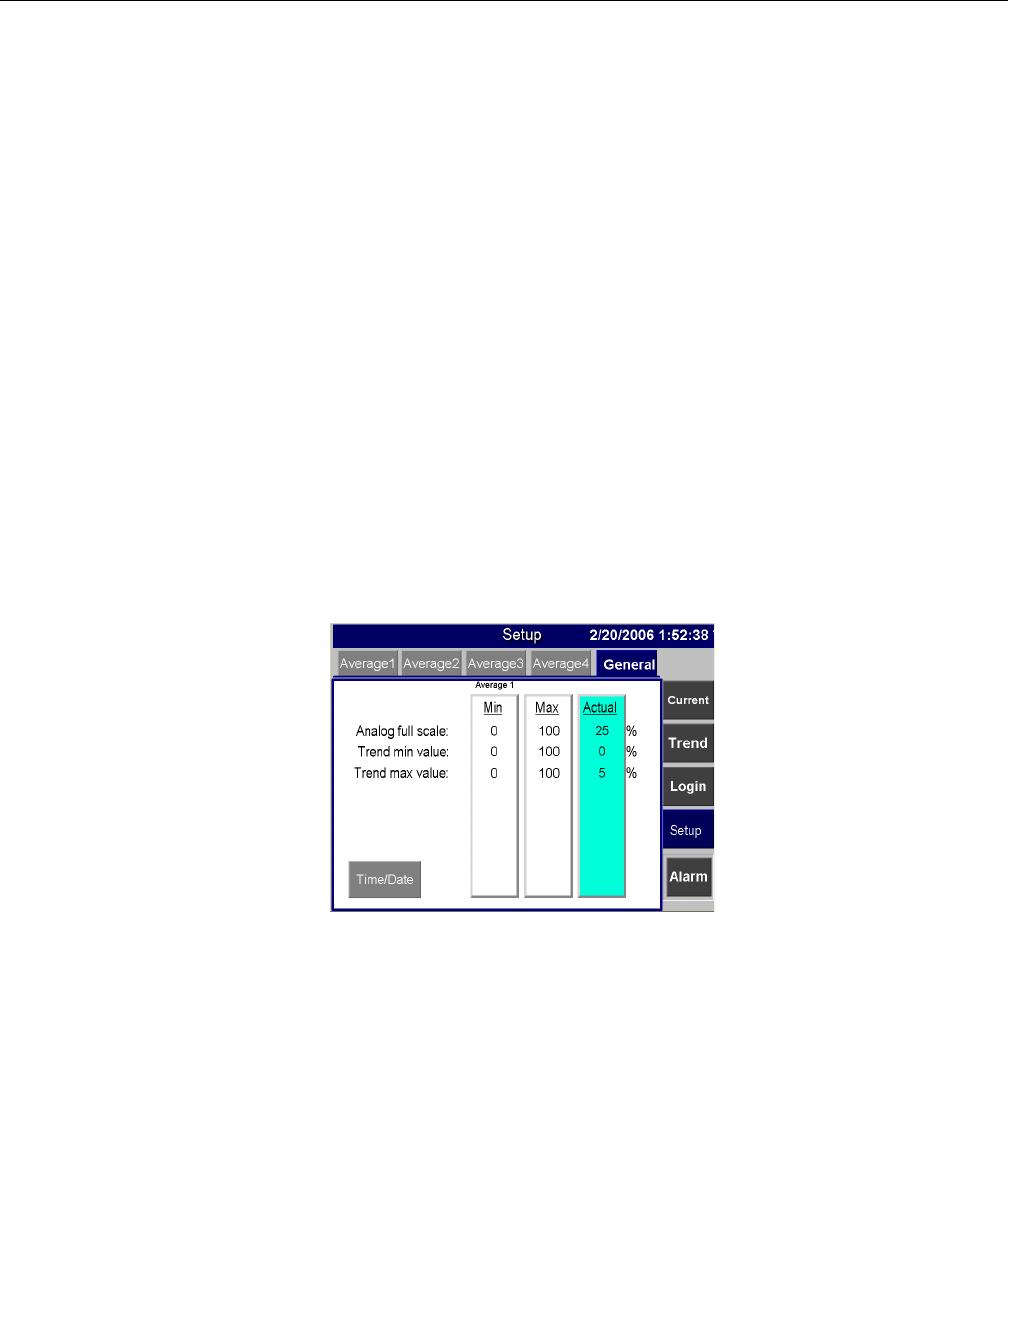
Under this tab the values for the Analog full scale, Trend min value and
Trend max value, can be changed to represent more of an applicable
scale when displaying the probe or average outputs. See Figure 3-3.
• Analog full scale - This setting controls the O
2
% value represented by
the incoming 4-20 mA signals, and the average O
2
% output signals. All
input signals must represent the same full scale value.
• Trend min value - This values allows the adjustment of the minimum
value displayed on the trend graphs on the touch screen display,
allowing the display to zoom in on the range of interest. This setting
only affects the displayed values. It has no affect on the average O
2
%
output signals.
• Trend max value - This values allows the adjustment of the maximum
value displayed on the trend graphs on the touch screen display,
allowing the display to zoom in on the range of interest. This setting
only affects the displayed values. It has no affect on the average O
2
%
output signals.
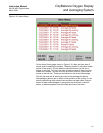
Figure 3-3. Scale Values Setup


