


29
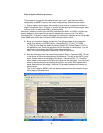
Functional and Performance Analysis – NOTE: The Functional Performance
portion of this software will NOT work with 2 FRAME configurations
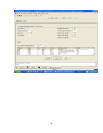
This window tab provides the ability to initiate the analysis of a trace file in either on or
off-line mode using the “Start Analysis” button. Additionally, when used in on-line mode
it can capture a trace file using the “run” command or initiate repetitive runs and additive
Tool analysis of each run.
Statistics
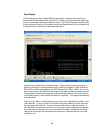
The performance analysis of the DDR2 DIMM bus over the entire captured trace file is
displayed in the “Statistics” section. This shows information regarding the total number
of clock cycles and Commands that are included in the analyzed trace file, as well as the
total number of errors found. The error count is based on the errors selected in the
Setup. Also, included in this display is information on the Read, Write and Data activity
occurring during the captured trace file.
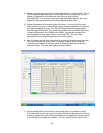
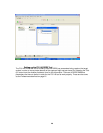
Errors
This section of the tool displays comprehensive information about the location and
nature of each selected error found in the captured trace file. The user can scroll
through the error listing and either select one error by left clicking on the error to set a
“DDR” marker in the State and Waveform listings, or the user can select the “Place
Markers on All” button which will place uniquely numbered markers (DDRx) on all
identified errors.
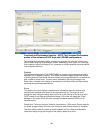
Please note: The errors listing is limited to a maximum of 1,000 errors. Placing markers
on all with a large number of errors in the listing can take several minutes to complete,
The error markers allow the users to switch between the Tool, State, and Waveform
information easily during the analysis of the activity related to an error.