


23
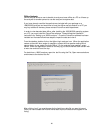
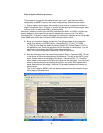
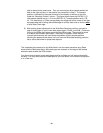
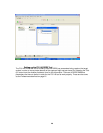
label to be set to the same value. Then you can drag the blue sample position bar
back to the right to place it in the position you measured in step 5. The sample
position is indicated on the scale at the top of the display as well as on the side
under the “Sampling Position” column. The figure above shows the DATA31-0_R
label sample position set to .110 ns and DATA31-0_F sample position set to 1.59
ns. This means that a 1.59ns average delay was measured to the center of the data
eye associated with a falling data strobe edge for a Write data burst on the bus after
a valid State Clock edge.
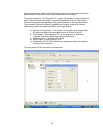
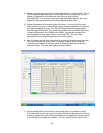
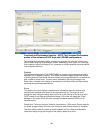
8) After making these adjustments to the Write Data Sampling positions, go back to
step #1 and trigger on your known data pattern again. Check your Write - Command
listing for the State data values across multiple Write bursts. They should be close
to or equal to the known data written. There may be a pattern of bits that are
incorrect and those bits will need further adjustment to their sample positions
following the steps outlined above until you have the Write data sampling positions
set to values that allow for proper data capture.
This completes the procedure for the Write labels. Use the same procedure using Read
bursts and the Read data labels. Write data eyes are centered on the edge of the strobes
whereas reads straddle the DQS strobes.
You should now be ready to take state traces and be confident you will capture bus traffic
correctly. You may want to save the settings that you have either in the current configuration
or in a new one.