


63
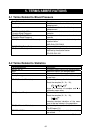
Term/Abbreviation Description
CORRELATION: r
(Coefficient of Correlation)
Indicates the degree of linear relationship
between two variables. It ranges from +1 to
-1. A correlation of +1 means that there is a
perfect positive linear relationship between
variables.
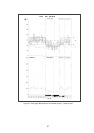
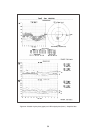
Sys – dia In the plotted 24-hour blood pressure data,
indicates high blood pressure using the limits
of the systolic and diastolic blood pressures.
Sys – pul In the plotted 24-hour blood pressure data,
indicates the degree to which the pulse and
the systolic blood pressure are related.
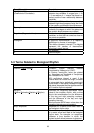
Reg. Line (Regression Line) A line drawn through a scatterplot of two
variables so that the line comes as close to
the points as possible.
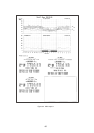
Histogram A graphical representation of a frequency
distribution by means of rectangles.
The widths represent intervals. The heights
represent the number of observations
occurring in each interval.
F Full analysis
P Partial analysis
5-3 Terms Related to Biological Rhythm
Term/Abbreviation Description
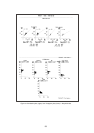
Cosinor (Cosine Vector) Circadian rhythm analysis method
introduced by Halberg et al (1967).
In Cosinor, twenty-four hours are plotted
on. Acrophase and Amplitude of Acrophase
are indicated on an r-axis.
95% confidence interval is used. If the
interval does not include the origin, the data
is interpreted that a statistically meaningful
rhythm exists. If the interval includes the origin,
the data is interpreted that the significance level
is 5% and the rhythm is rejected.
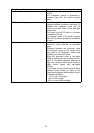
MESOR
(Midline E
stimating Statistic of Rhythm)
Indicates the objectively-expressed mean
value of the circadian rhythm, with no bias
due to the considerations on the difference
of the day and night sampling numbers,
and the difference of the day and night
sampling intervals.
More accurate ABPM mean value when the
sampling intervals are not constant.
Amp. Amplitude Amplitude of a cosine curve best fitted to
the biological rhythm data.
Acrophase Phase that represents the maximum value
of a cosine curve best fitted to the biological
rhythm data. For example, an acrophase
indicates a time duration in which the
highest systolic blood pressure is obtained.
Continued