


10
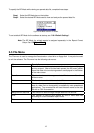
2-4 Toolbar
There are two toolbar buttons which appear underneath the main menu bar:
(1) Analysis Intervals
(2) BP Mode
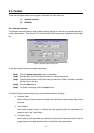
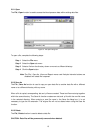
2-4-1 Analysis Intervals
The Analysis Intervals feature is used to define specific periods of time within an opened data file for
custom data analysis. Two intervals, Full Analysis and Partial Analysis may be defined for each data
file.
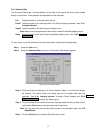
Figure 4: Analysis Intervals dialog box
To set the Analysis Intervals, complete these steps:
Step 1 Click the Analysis Intervals button on the toolbar.
Step 2 Set each item in the Full analysis interval box, using the scroll bar.
Step 3 Check a Status button in the Partial analysis interval box. When “Enabled” is checked,
set each item in the box.
Step 4 Click the Save button.
Step 5 To cancel the settings, click the Cancel button.
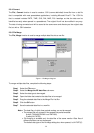
The Partial Analysis Interval affects many of the software features including:
♦ Summary Data
After the Partial Analysis Interval is enabled, the Partial tab in the Summary Data will be
activated.
♦ Trend Graphs
After Partial Analysis Interval is defined, the data specified within the parameters will
appear in red on the Trend Graph.
♦ Correlation Plots
After Partial Analysis parameters are defined, a second set of Correlation plots in red will
appear based on the data specified within the Partial Analysis parameters.