


27
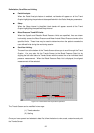
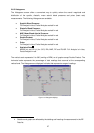
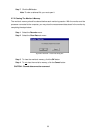
2-6-5 Histograms
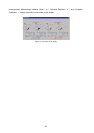
The Histograms screen offers a convenient way to quickly review the overall magnitude and
distribution of the systolic, diastolic, mean arterial blood pressures and pulse (heart rate)
measurements. The following Histograms are available:
♦ Systolic Blood Pressure:
Full Analysis in blue, Partial Analysis overlaid in red.
♦ Diastolic Blood Pressure:
Full Analysis in blue, Partial Analysis overlaid in red.
♦ MAP, Mean Blood Arterial Pressure:
Full Analysis in blue, Partial Analysis overlaid in red.
♦ Double Product:
Full Analysis in blue, Partial Analysis overlaid in red.
♦ Pulse:
Full Analysis in blue, Partial Analysis overlaid in red.
♦ Statistical Data
4
:
MEAN (m) and SD (s’) for: SYS, DIA, MAP, DP and PULSE. Full Analysis is in blue,
Partial Analysis in red.
The vertical scale represents 0 to 300 (mmHg or BPM) on all graphs except Double Product. The
horizontal scale represents the percentage of total readings that occurred at the corresponding
vertical level. The Histograms are displayed in blocks that represent a range of readings.
Figure 15: Histograms display
4 Statistics and graphs are effected by the deleting and inserting of measurements in the BP
Data list.