


28
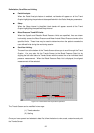
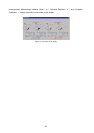
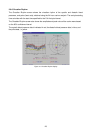
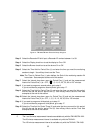
2-6-6 Circadian Rhythm
The Circadian Rhythm screen shows the circadian rhythm of the systolic and diastolic blood
pressures, and pulse (heart rate); obtained using the 24-hour cosinor analysis. The analysis starting
time coincides with the start time specified for the Full Analysis interval.
The Circadian Rhythm screen also shows the amplitude and peak value of the cosine wave based
on the 95% confidence interval.
The systolic blood pressure data is indicated in red, the diastolic blood pressure data, in blue, and
the pulse data , in yellow.
Figure 16: Circadian Rhythm display