


29
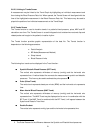
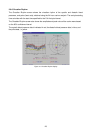
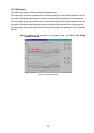
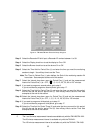
2-6-7 HIB Analysis
The HIB analysis screen shows two graphs arranged vertically.
The upper graph shows the hyperbalic area (in red) exceeding the user-defined hyperbalic limits for
the systolic and diastolic blood pressures, and the numerical data converted into a one-day period.
The lower graph shows the hypobalic area (in red) not reaching the user-defined hypobalic limits for
the systolic and diastolic blood pressures, and the numerical data converted into a one-day period.
For both graphs, the analysis starting time coincides with the start time specified for the Full Analysis
interval.
Note: For details on the hyperbalic and hypobalic limits, see “2-9-4-1 BP (Blood
Pressure) Settings”.
Figure 17: HIB analysis display