


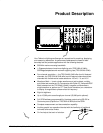


Example 1: Displaying a Waveform
TDS 620A, 640A, & 644A User Manual
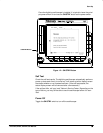
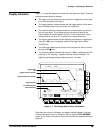
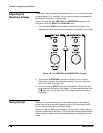
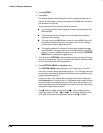
Figure 1-7 shows the display that results from the instrument reset. There are
several important points to observe:
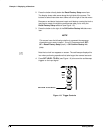
The
trigger level bar
shows that the waveform is triggered at a level near
50% of its amplitude (from step 4).
The
trigger position indicator
shows that the trigger position of the wave-
form is located at the horizontal center of the graticule.
The
channel reference indicator
shows the vertical position of channel 1
with no input signal. This indicator points to the ground level for the
channel when its vertical offset is set to 0 V in the vertical menu; when
vertical offset is
not
set to 0 V, it points to the vertical offset level.
The
trigger readout
shows that the digitizing oscilloscope is triggering on
channel 1 (Ch1) on a rising edge, and that the trigger level is about
200–300 mV.
The
time base readout
shows that the main time base is set to a horizon-
tal scale of 500 s/div.
The
channel readout
indicates that channel 1 (Ch1) is displayed with DC
coupling. (In AC coupling, ~ appears after the volts/div readout.) The
digitizing oscilloscope always displays channel 1 at reset.
Time Base Readout
Channel Reference Indicator
Trigger Readout
Trigger Position Indicator
Trigger Level
Bar
Channel Readout
Figure 1-7: The Display After Factory Initialization
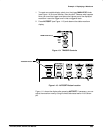
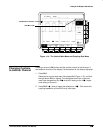
Right now, the channel, time base, and trigger readouts appear in the grati-
cule area because a menu is displayed. You can press the CLEAR MENU
button at any time to remove any menus and to move the readouts below the
graticule.
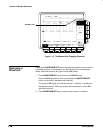
Display Elements