


page 21
COMMERCIAL PRODUCTS DIVISION
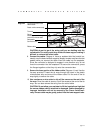
The course profile represents Cross Ramp
TM
incline settings which can vary
between 1 to 14. The lowest row of LED’s represent level 1 and 2, the next row
represents levels 3 and 4, and so on. If Smart Rate
®
is displayed, then the two
columns on the right are not used by the profile display.
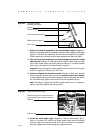
Smart Rate
®
: You must enter your “Age” (during the course Setup prompts) and
wear a POLAR
®
chest strap (while in a course program) so that your heart rate
can be detected. Once a heart rate is detected, the Smart Rate column lights up
and a blinking segment in the bar graph (on the right of the center display) shows
the zone that your heart rate is in, either Cardiovascular or Weight Loss.
❑❑
❑❑
❑ Cardiovascular Zone: Maintaining your heart rate between 70% and 85%
of your maximum aerobic heart rate, helps you (when continued on a
regular basis for 30 minutes or more) improve your overall cardiovascu-
lar/cardiorespiratory fitness level.
❑❑
❑❑
❑ Weight Loss Zone: Maintaining your heart rate between 55% and 70% of
your maximum aerobic heart rate, helps burn enough calories that, when
continued on a regular basis for 30 minutes or more, provides the great-
est fat-burning results.
Important: During a course, your heart rate must be above 40 beats per
minute before the segment begins to blink. Note that pressing Quick Start
disables the Smart Rate
®
display feature.
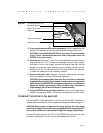
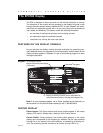
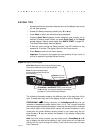
Workout Statistics: Seven items, that relate to your workout, appear on the display
once you begin a course. After entering a course, the profile appears for about 18
seconds and then each “workout statistic” appears in sequence (starting from the
top) for 5 seconds — this is called
scanning
. An LED (indicator light) is highlighted
next to the workout statistic so you know what information is being displayed.
Scanning: Lets you evaluate your workout and change certain aspects like,
the CrossRamp
TM
incline or resistance by using the appropriate ▼▲ keys, or
strides per minute, the amount of calories being burned, and your heart rate by
changing the pedaling speed. As stated above, each “workout statistic” appears
in sequence (starting from the top) for 5 seconds after the course profile has
been displayed for approximately 18 seconds.
Any time during your workout, you can stop
scanning
and hold the display to any
one item. While the indicator light is highlighted next to the workout statistic you
wish to remain displayed, press the Scan/Hold key. A prompt appears indicating
that you are moving to “HOLD” the display static mode. If the display is static
(displaying one item), resume scanning by pressing the Scan/Hold key again. A
“SCAN” prompt appears and scanning resumes where it left off.
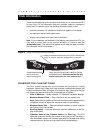
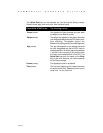
The items that appear in the display during a workout are described below.
CrossRamp
TM
: Displays the CrossRamp incline numerically (1 through 14).
This display and the corresponding ramp incline are affected by pressing the
CrossRamp ▲▼ keys.
Resistance Level: Indicates the degree of effort (1 through 20) associated
with the foot pedal resistance. This display and the corresponding ramp incline
are affected by pressing the Resistance ▼▲ keys.