


General Information
Specifications
1
1-5
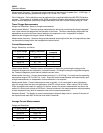
1.0000 μA 0.0001 μA
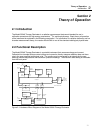
Measurement Method: Average current measurement is derived by monitoring the charge integrated
over the time interval beginning 1.33 seconds after the detection of the start of the exposure, and ending
1.33 seconds prior to the detection of the end of the exposure. Dividing the charge integrated over this
interval by duration of the time interval yields the average current value.
Measurement Accuracy: The accuracy of the average current value in %rdg is approximately equal to
the accuracy of the integrated charge measurement value from which it is produced. This value may be
calculated by converting the “counts” contribution to a %rdg and summing this value with the inherent
0.20%rdg base accuracy of the charge measurement. Since the average current measurements are
based directly upon charge measurements, an independent current calibration is not required.
Measurement Noise: Average current measurement noise decreases as the integration time interval
increases. Typically, the noise in the average current measurement after a 100 second integration
interval will be 10 times less than is present in the current measurement.
Response Speed: The display of average current measurement values will begin within 4 seconds of the
start of the exposure.
Effective Exposure Time Measurements
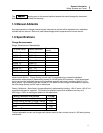
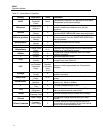
Range and Resolution:
Full Scale Range
Seconds Hours/Minutes/Seconds
Display Resolution
59.99 s 59.99 s 0.01 s
19,999.9 s 5 h 33 min 19.9 s 0.1 s
Measurement Method: The effective exposure time value is calculated as the quotient of the charge and
average current measurement values. A minimum exposure duration of 3.5 seconds is required to
produce an effective exposure time measurement value.
Measurement Accuracy: Although the accuracy of the effective exposure time measurement value is
directly dependent upon the accuracy of the internal oscillator frequency (better than ± 0.01%), more
important to the achievable accuracy of this measurement are the effects of linearity and noise in the
exposure and average current measurement values upon which it is based. In practice, an upper limit of
the error in the exposure time value in %rdg will be equal to the %rdg noise observed in the average
current display values.
Response Speed: The display of effective exposure time values will begin within 4 seconds of the start of
the exposure.
General Measurements
Dose Conversion: Dose measurement values are calculated by forming the product of the measured
charge, ion chamber calibration factor, and the air density correction factor.
Dose Rate Conversion: Dose Rate measurement values are calculated by forming the product of the
measured current, ion chamber calibration factor, air density correction factor, and time unit multiplier.
Measurement Non-Linearity: The maximum variation from a straight line is ± 0.1% of range on all charge
and current ranges.
Long Term Stability: Ultra high long-term stability on the order of 0.1% per 5 years for both charge and
current measurements is expected. Long-term measurement stability is verified as a part of each factory
recalibration using inputs of -1.90 nC and ± 19.0 nC for charge and 19.0 nA for current. Compliance to
the warranted specifications is considered satisfied if the observed measurement errors (%rdg) meet the
following equations: