Color Gauges and Running Dynamics Data
The running dynamics screen displays a color gauge for the primary metric. You can display cadence, vertical oscillation, or ground
contact time as the primary metric. The color gauge shows you how your running dynamics data compares to those of other
runners. The color zones are based on percentiles.
Garmin has researched many runners of all different levels. The data values in the red or orange zones are typical for less
experienced or slower runners. The data values in the green, blue, or purple zones are typical for more experienced or faster
runners. Less experienced runners tend to exhibit longer ground contact times, higher vertical oscillation, and lower cadence than
more experienced runners. However, taller runners typically have slightly slower cadences and slightly higher vertical oscillation. Go
to www.garmin.com for more information on running dynamics. For additional theories and interpretations of running dynamics data,
you can search reputable running publications and websites.
Color Zone Percentile in Zone Cadence Range Vertical Oscillation Range Ground Contact Time Range
Purple >95 >185 spm <6.7 cm <208 ms
Blue 70–95 174–185 spm 6.7–8.3 cm 208–240 ms
Green 30–69 163–173 spm 8.4–10.0 cm 241–272 ms
Orange 5–29 151–162 spm 10.1–11.8 cm 273–305 ms
Red <5 <151 spm >11.8 cm >305 ms
Tips for Missing Running Dynamics Data
If running dynamics data does not appear, you can try these
tips.
• Make sure you have the HRM-Run accessory.
The HRM-Run accessory has on the front of the module.
• Pair the HRM-Run accessory with your Forerunner again,
according to the instructions.
• If the running dynamics data display zeros, make sure the
HRM-Run module is worn right-side up.
NOTE: Ground contact time appears only while running. It
cannot be calculated while walking.
Tips for Erratic Heart Rate Data
If the heart rate data is erratic or does not appear, you can try
these tips.
• Reapply moisture to the electrodes and contact patches.
• Tighten the strap on your chest.
• Warm up for 5–10 minutes.
• Wash the strap after every seven uses (Caring for the Heart
Rate Monitor).
• Wear a cotton shirt or wet your shirt if suitable for your
activity.
Synthetic fabrics that rub or flap against the heart rate
monitor can create static electricity that interferes with heart
rate signals.
• Move away from sources that can interfere with your heart
rate monitor.
Sources of interference may include strong electromagnetic
fields, some 2.4 GHz wireless sensors, high-voltage power
lines, electric motors, ovens, microwave ovens, 2.4 GHz
cordless phones, and wireless LAN access points.
About VO2 Max. Estimates
VO2 max. is the maximum volume of oxygen (in mililiters) you
can consume per minute per kilogram of body weight at your
maximum performance. In simple terms, VO2 max. is an
indication of athletic performance and should increase as your
level of fitness improves. VO2 max. estimates are provided and
supported by Firstbeat
®
Technologies Ltd. The Forerunner
device has separate VO2 max. estimates for running and
cycling. You can use your Garmin device paired with a
compatible heart rate monitor and power meter to display your
cycling VO2 max. estimate. You can use your Garmin device
paired with a compatible heart rate monitor to display your
running VO2 max. estimate.
Getting Your VO2 Max. Estimate for Running
Before you can view your VO2 max. estimate, you must put on
the heart rate monitor and pair it with your device (Pairing Your
ANT+ Sensors). If your Forerunner device was packaged with a
heart rate monitor, the devices are already paired. For the most
accurate estimate, complete the user profile setup (Setting Up
Your User Profile), and set your maximum heart rate (Setting
Your Heart Rate Zones).
NOTE: The estimate may seem inaccurate at first. The device
requires a few runs to learn about your running performance.
1
Run for at least 10 minutes outdoors.
2
After your run, select Save.
3
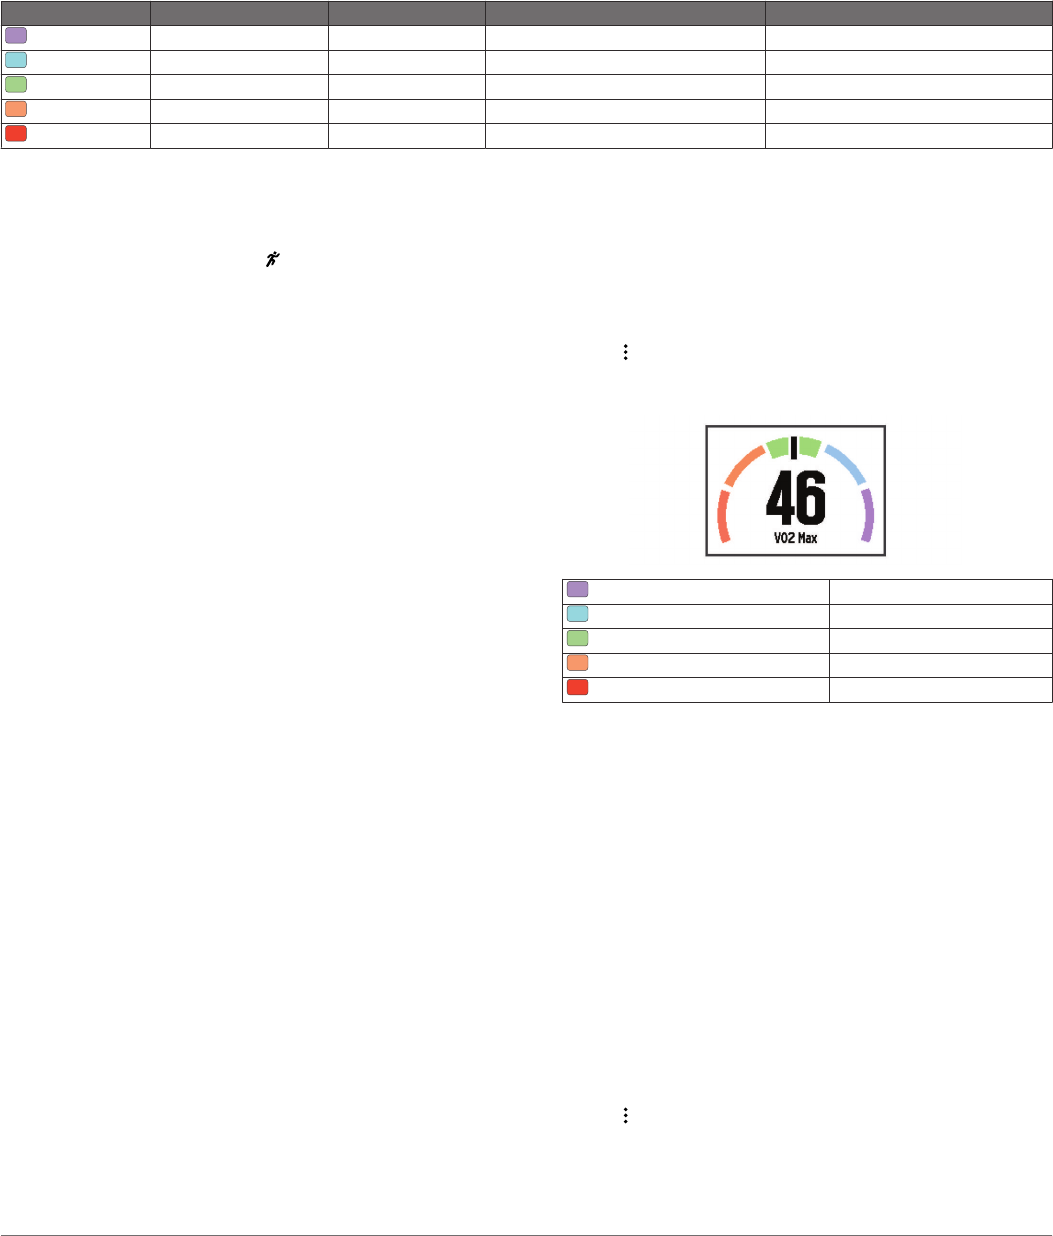
Select > My Stats > VO2 Max..
Your VO2 max. estimate is a number and position on the
color gauge.
Purple Superior
Blue Excellent
Green Good
Orange Fair
Red Poor
VO2 max. data and analysis is provided with permission from
The Cooper Institute
®
. For more information, see the
appendix (VO2 Max. Standard Ratings), and go to
www.CooperInstitute.org.
Getting Your VO2 Max. Estimate for Cycling
Before you can view your VO2 max. estimate, you must put on
the heart rate monitor, install the power meter, and pair them
with your Forerunner device (Pairing Your ANT+ Sensors). If
your Forerunner device was packaged with a heart rate monitor,
the devices are already paired. For the most accurate estimate,
complete the user profile setup (Setting Up Your User Profile)
and set your maximum heart rate (Setting Your Heart Rate
Zones).
NOTE: The estimate may seem inaccurate at first. The device
requires a few rides to learn about your cycling performance.
1
Ride at a steady, high intensity for at least 20 minutes
outdoors.
2
After your ride, select Save.
3
Select > My Stats > VO2 Max..
Your VO2 max. estimate is a number and position on the
color gauge.
ANT+ Sensors 9


