


Application/ Molecular Interaction Analysis
0 µs
0 ms
0 ms
1 ms
2 ms
3 ms
4 ms
n ms
10 µs 20 µs 30 µs 40 µs 50 µs n µs
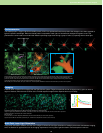
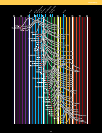
Molecule size
Small Large
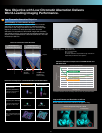
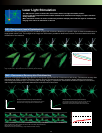
Spatial Correlation Algorithm
When the spatial correlation algorithm is applied between pixels, a higher correlation
is obtained as the speed of movement of the molecule nears the scanning speed.
When calculating the spatial correlation in the X-direction, because the scanning
speed in the X-direction is fast, a higher correlation is obtained for fast-moving
molecules than for slow-moving molecules. When the scanning speed in the Y-
direction is slow, a higher correlation is obtained for slow-moving molecules. RICS
using LSM images scans in both X- and Y-directions, so it can be used to analyze
the movements of a wide range of molecules, both fast and slow.
Scan in X-Axis Direction
Scan in Y-Axis Direction
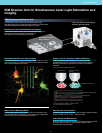
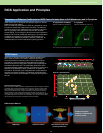
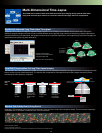
RICS Application and Principles
RICS Principle
Molecules of different sizes diffuse at different speeds within
cells. Small molecules move faster, compared with large
molecules that move relatively slowly. The FV1000 acquires
information on the movement of these diffusing fluorescent-
labeled molecules as image data, together with morphological
information about the cell. The image data obtained for each
pixel was sampled at different times, so the data for each pixel is
affected by the passage of time, in addition to its spatial XY
information. By analyzing this image data with a new statistical
algorithm for spatial correlation, the diffusion coefficients and
molecule counts can be calculated for molecules moving within
the cell.
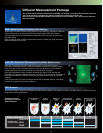
RICS Analysis Method
Theoretical Formula Used
for Fitting Calculation
Results of Analysis
(diffusion coefficient and
molecule count)
LSM Image Spatial Correlation
16
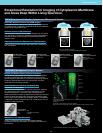
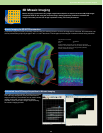
At cytoplasmic membrane
Diffusion coefficient D =0.98 µm
2
/s
In cytoplasm
Diffusion coefficient D =3.37 µm
2
/s
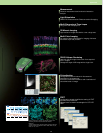
Sample image:
HeLa cells expressing EGFP fusion PKC (after PMA stimulation)
Comparison of Diffusion Coefficients for EGFP Fusion Proteins Near to Cell Membranes and In Cytoplasm
RICS can be used to designate and analyze regions of interest
based on acquired images.
EGFP is fused at protein kinase C (PKC) for visualization, using
live cells to analyze the translocation with RICS. The diffusion
coefficient close to cell membranes was confirmed to be lower
than in cytoplasm, after stimulation with phorbol myristate
acetate (PMA). This is thought to be from the mutual interaction
between PKC and cell membrane molecules in cell membranes.
In addition to localization of molecules, RICS analysis can
simultaneously determine changes in diffusion coefficient, for
detailed analysis of various intracellular signaling proteins.