


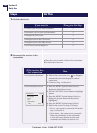


Steps Do This
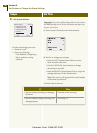
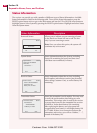
4. Interpret the icons.
Note: e directional trend arrows are dierent from the
projected glucose alarms (Section 8). For example, you
can have a projected low glucose alarm and still have a
relatively stable trend arrow.
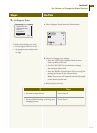
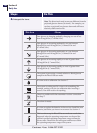
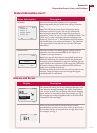
is Icon Means
Your glucose is changing gradually, changing at a rate of less
than 60 mg/dL/hr (3.3 mmol/L/hr).
Your glucose is increasing moderately, at a rate between
60 mg/dL/hr and 120 mg/dL/hr (3.3 mmol/L/hr and
6.7 mmol/L/hr).
Your glucose is decreasing moderately, at a rate between
60 mg/dL/hr and 120 mg/dL/hr (3.3 mmol/L/hr and
6.7 mmol/L/hr).
Your glucose is increasing rapidly, at a rate of greater than
120 mg/dL/hr (6.7 mmol/L/hr).
Your glucose is decreasing rapidly, at a rate of greater than
120 mg/dL/hr (6.7 mmol/L/hr).
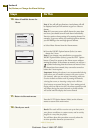
e system is processing a control solution or blood glucose
sample in the Blood Glucose mode.
It is time to do a calibration. See Section 7.
e system is waiting until it is time to do something (for
example, waiting to do the 1st calibration aer inserting a
sensor). You don’t need to do anything.
ere is a problem with the transmitter-receiver connection.
See Step 2.
e alarm is muted.
It is time to replace the batteries in the receiver. Install the new
batteries just before you insert a new sensor. See Section 2.
is icon shows up for Blood Glucose mode test results that
happened when the operating temperature was beyond the
system’s specied operating temperature range and may be
less accurate. Discard the test and repeat another test within
the operating temperature range of the system.
Customer Care: 1-866-597-5520
84 Section 9
Daily Use