


OVER
18 Appendix B: Specications (con’t)
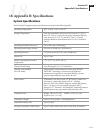
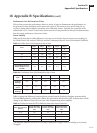
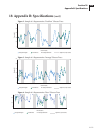
Performance Over the Duration of Wear
This section presents the performance data in a variety of ways to demonstrate the performance of
the system over time during the entire sensor wear period. The sensor is worn on the body for up
to 5 days, during which time the system has to be calibrated 4 times. Typically, the system has to be
calibrated at 10, 12, 24 and 72 hours after sensor insertion. Data presented in this section demonstrates
how the sensor performs as a function of time.
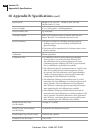
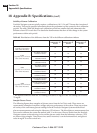
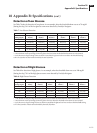
Sensor Stability
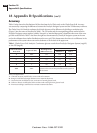
Tables 6a-6b show there is little difference in accuracy over the five days of sensor wear according to
the Clarke Error Grid Analysis (Table 6a) and the Continuous Glucose-Error Grid Analysis (Table 6b).
Table 6a. Clarke Error Grid Analysis by day of wear
Zone
Day 1 Day 2 Day 3 Day 4 Day 5
% % % % %
A 82.5 82.4 79.4 84.0 80.9
B 16.4 16.6 18.3 14.2 16.9
C 0.2 0.1 0.0 0.0 0.0
D 0.9 0.9 2.2 1.8 2.1
E 0.0 0.1 0.0 0.0 0.0
Overall Mean Absolute
Relative Dierence (%)
MARD0
12.6 12.3 14.1 11.9 13.0
Table 6b. Continuous Error Grid Analysis by day of wear
Zone
Day 1 Day 2 Day 3 Day 4 Day 5
% % % % %
Accurate
Readings
97.9 97.8 97.1 97.4 97.3
Benign
Errors
1.0 1.2 0.7 0.8 0.8
Erroneous
Readings
1.1 1.0 2.2 1.8 1.9
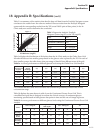
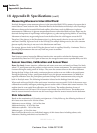
Table 6c groups the dierence between glucose results from the FreeStyle Navigator system and the
YSI into dierent blocks (within 20%, within 30% and within 40% from the YSI). It shows there is little
change in the dierence from YSI over time, thus demonstrating sensor stability.
Table 6c.
Difference from the YSI at different times after sensor insertion
Time Aer Insertion
(hours)
Percent Readings
Within 20% of the
YSI*
Percent Readings
Within 30% of the
YSI*
Percent Readings
Within 40% of the
YSI*
10-12 86 92 96
12-24 82 93 97
24-72 81 92 97
72-122 82 93 97
*e absolute dierence from the YSI reading is measured in mg/dL if the YSI reading is at or below
75 mg/dL.
Section 18 157
Appendix B: Specifications