


28
State Analysis Operation
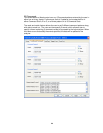
For proper state analysis the user must choose the correct configuration file to load
depending on what type of analysis is desired, such as analyzing both Northbound and
Southbound activity or just one direction. The list of configuration files provided is on
page 12.
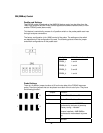
Load the appropriate configuration file and use the General Purpose probe feature for
proper cable attachment to the probe, for more information on the General Purpose
probe feature please see the section titled “Loading 169xx configuration files and
General Purpose Probe feature”. When the configuration file loads the decoder will
automatically load providing the software has been properly licensed.
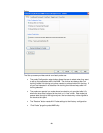
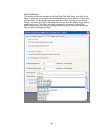
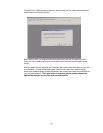
For proper protocol decoder performance you must insure the preferences are set
properly. Once the configuration file is loaded go to Tools, select FBDIMM Protocol
Decoder -1 and select Preferences. Set the failover modes for the Southbound and or
Northbound if necessary. The default settings are set to none. When you choose a
Northbound failover mode you must select which lane(s) has failed as well.
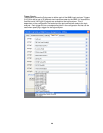
Once the configuration file has been loaded and all cables are attached to the probe, the
next step is to configure the probe. Please refer to the section of the manual titled
“Using the Probe Control Application”. The probe control application allows the user to
set different parameters of the probe to allow certain data to be passed through to the
analyzer.
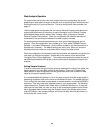
Setting Sample Positions
In order to insure that the logic analyzer properly measures the output of the probe, the
sample positions for each label need to be set properly. There are 4 “Sample Data”
labels defined in each configuration file that group each North and Southbound data
signal by its required sample position.
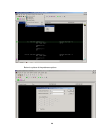
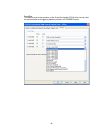
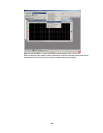
It is recommended that Eyefinder is run on the logic analyzer while the target system is
generating consistent traffic on the North and Southbound lanes. The sample positions
in the config fields have been preset based on measurements in a test bed at 533MT/s
data rates. They may need to be adjusted based on your target system. The following
image shows the 4 “Sample Data” labels after an Eyefinder has been run. If there are
clear eyes for each label, the user can drag all the blue sample position bars to the far
left to aggregate them and then drag the single bar back to the window where it was
originally located. If the sample positions are not set correctly then the data shown on
the analyzer will not be correct.