


2524
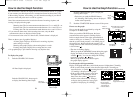
How to Use the Graph Function Continued
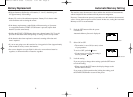
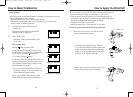
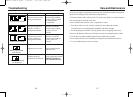
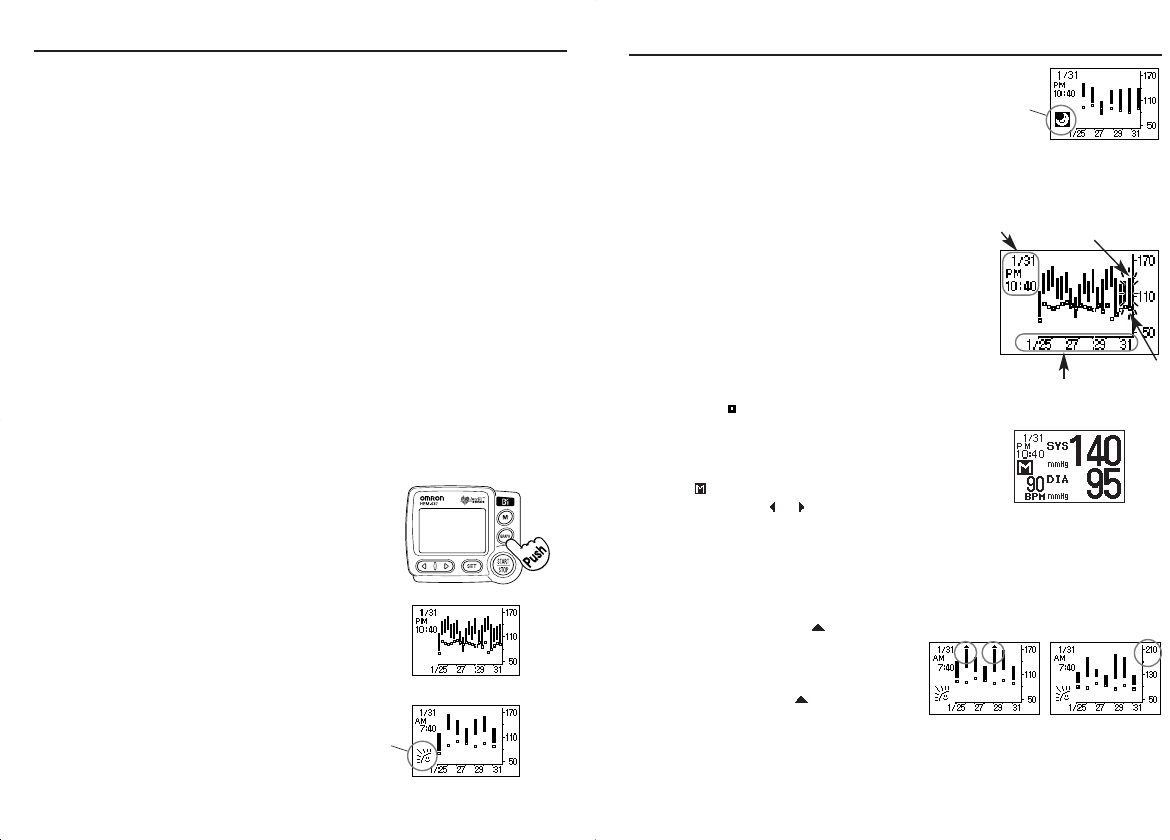
For the people with hypertension:
Display of the graph when the systolic blood pressure is higher than 170 mmHg
• If the systolic blood pressure values that are higher than 170 mmHg are
measured twice, a symbol (meaning that the systolic pressure is higher than
170 mmHg) is displayed on the graph.
• If the systolic blood pressure values that
are higher than 170 mmHg are stored
three times, the symbol disappears
and the screen automatically changes
to display the hypertension type graph
(capable of displaying 210 mmHg).
Night Data Graph
Detail Screen of Data
in Flashing Display
Display screen
where the systolic
blood pressure
values higher than
170 mmHg are
measured twice
Graph Display
Screen of
Hypertension Type
Night
Data
Mark
Date of
Measurement
Month/Days
of a Week
Pulse
Rate
Blood Pressure Values
(systolic/diastolic)
(mmHg)
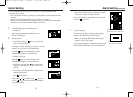
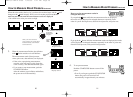
Push the GRAPH button again to display the
Evening Data Graph.
• Each time you push the GRAPH button,
All, Morning, and Evening data are displayed
in that order repeatedly.
2. Push the START/STOP button to turn off the power.
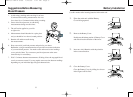
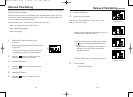
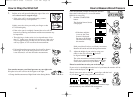
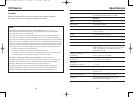
How to see the graph
How to see the graph is explained by using the
example of All Data Graph.
When you push the GRAPH button, the latest
measurement results appear in flashing display.
In the example shown to the right, measurement is
made at 10:40 p.m. on January 31. The graph shows
that the systolic blood pressure is 140 mmHg (top of
the vertical bar), the diastolic blood pressure is 95
mmHg (bottom of the vertical bar), and the pulse rate
is 90 a minute ( ).
• The data in flashing display:
When you push the MEMORY button during the graph
display, the details of data in flashing display appear
with the mark. You can also change the flashing
position by pushing or button.
When you push the GRAPH button again,
the graph display appears.
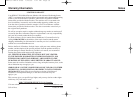
How to Use the Graph Function
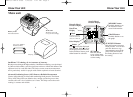
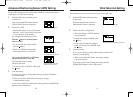
To display the graph
1. Push the GRAPH CALL button.
All Data Graph is displayed.
Push the GRAPH CALL button again
to display the Morning Data Graph.
All Data Graph
Morning
Data Graph
Morning
Data Mark
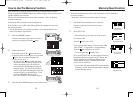
This monitor has a function to display the stored measurement results as a graph.
If you measure your blood pressure in a certain time frame for three times a day
in the morning, daytime, and evening, you will learn the trending of your blood
pressure values and pulse rate in a week at a glance.
One of the measurement results in each time frame of morning, daytime, and
evening is displayed in the graph.
Morning data: The last measurement made between 12
A.M. and 9:59 A.M.
Daytime data: The last measurement made between 10 A.M and 5:59 P.M.
Evening data: The last measurement made between 6 P.M. and 11:59 P.M.
• If you measure three times in the morning time zone, only the third
measurement values are displayed in the graph.
• If no measured value exists in a time frame, a blank column is displayed.
There are three types of graphical displays.
All data graph: Displays all the data for morning, daytime,
and evening in a week.
Morning data graph: Displays the morning data in a week.
Evening data graph: Displays the evening data in a week.
• No graph display is provided for showing only daytime data
.
HEM-637 REV A 8188 1/26/06 1:41 PM Page 24