


36 Stratos LV/LV-T Technical Manual
Primary Endpoint: Six Minute Walk Test & QOL
(Effectiveness)
The purpose of Primary Endpoint 1 was to evaluate the
effectiveness of the CRT (Groups 1 and 2) compared to RV only
(Group 3) pacing as measured by the average composite rate of
improvement in six minute walk test and QOL.
• Stratos LV Effectiveness (Group 2 compared to
Group 3): The average composite rate for Group 2
(N=30) was 48.1% with a standard error of 12.3%. The
average composite rate for Group 3 (N=15) was 33.0%
with a standard error of 12.3%. The difference in the
mean composite rate between Group 2 and Group 3 is
15.1%. The p value for superiority is 0.442.
• Protos DR/CLS Effectiveness (Group 1 compared to
Group 3): The average composite rate for the Group 1
(N=23) is 36.8% with a standard error of 7.9%. The
average composite rate for Group 3 (N=15) is 33.0%
with a standard error of 12.3%. The difference in the
mean composite rate between Group 1 and Group 3 is
3.8%. The p value for superiority is 0.788.
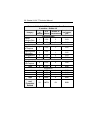
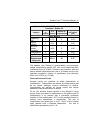
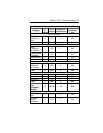
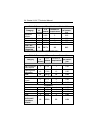
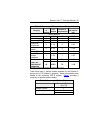
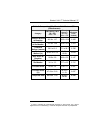
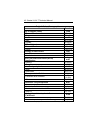
Table 8
presents the average composite rate of improvement in
six minute walk test distance and QOL score, the average 6-
minute walk test distance and the average QOL score at
Baseline and at the Six-Month follow-up, as well as the average
difference in 6-minute walk test distance and QOL score
between Baseline and the Six-Month follow-up for the CRT
(Groups 1 and 2) and RV only (Group 3) for those patients with
six minute walk test data and complete QOL data at both
Baseline and the Six-Month follow-up.