


HOW TO USE
English
19
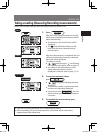
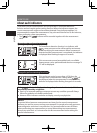
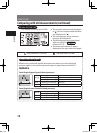
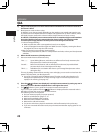
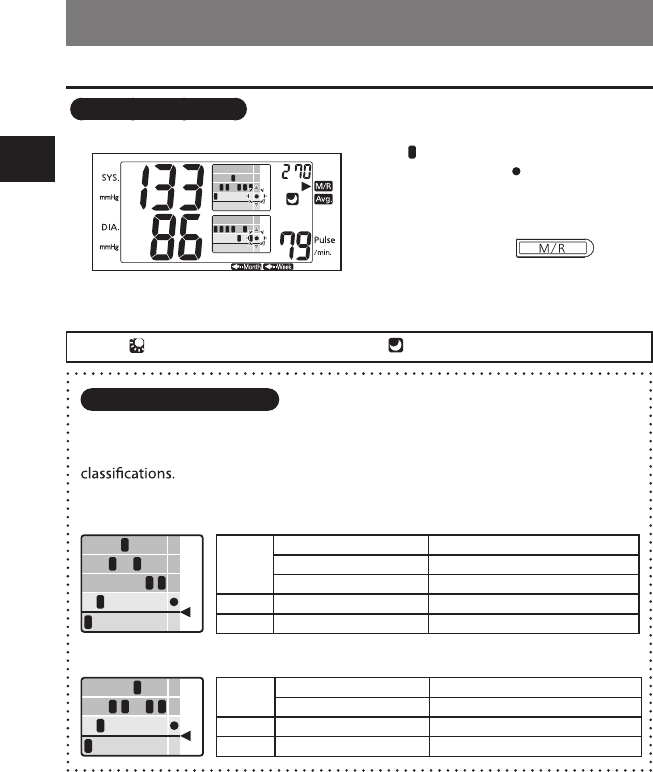
Whether the systolic and diastolic blood pressure values are in the high blood
pressure region or normal blood pressure region is judged based on the JNC 7
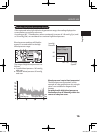
Trend Graph (Upper: Systolic blood pressure)
Orange
180mm
Hg
and over Hypertension (severe)
160mm
Hg
to 179mm
Hg
Hypertension (moderate)
140mm
Hg
to 159mm
Hg
Hypertension (mild)
Yellow 120mm
Hg
to 139mm
Hg
Borderline
Green less than 120mm
Hg
Normal blood pressure
Trend Graph (Lower: Diastolic blood pressure)
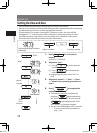
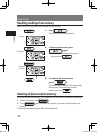
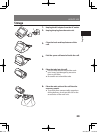
How to read the graphs
All data (All, AM, PM)
The recorded measurement (displayed
●
as "
") can be compared with the latest
one (displayed as "
").
The measurement can be switched
●
between All, AM and PM.
The blinking graph moves backward
●
with every press of
.
(Maximum 270)
The latest measurement is always
●
displayed at the right side of the graph.
Orange
100mm
Hg
and over Hypertension (severe, moderate)
90mm
Hg
to 99mm
Hg
Hypertension (mild)
Yellow 80mm
Hg
to 89mm
Hg
Borderline
Green less than 80mm
Hg
Normal blood pressure
*This display shows the case of "PM".
AM (3:00 AM to 11:00 AM) PM (6:00 PM to 2:59 AM)
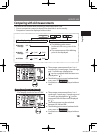
Comparing with old measurements (continued)
BU35.indb 19 2011/06/14 14:28:27