


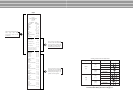
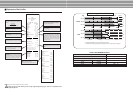


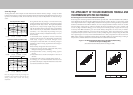

2) Inter-day changes
The diagrams below offer examples of actual measurements made of inter-day changes. A study was done
to determine the degree of change in the impedance between the feet during dehydration; the first two days
represent a normal daily routine, while in the latter two days a state of dehydration was induced using a
sauna.
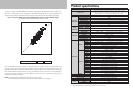
No significant inter-day change was measured in body
weight, impedance between the feet, or body fat percentage
during the normal daily routine. During the dehydrated
state, however, a drop in body weight of 1kg was noted,
with the impedance between the feet rising approximately
15Ω on the first day of dehydration and 30-35Ω on the
second day. As a result, body fat percentage was up by
around 1% on the first day of dehydration and by 1.5-2% on
the second day.
As mentioned earlier, impedance increases when body
weight is reduced (such as by dehydration), and decreases
when body weight is increased through excess
consumption of food and drink. The inter-day change in
impedance is thus inversely proportional to the change in
body weight.
These inter-day changes stem from such causes as:
1) Temporary increases in body weight (total body water)
through overeating and overdrinking
2) Dehydration due to heavy sweating during vigorous
exercise
3) Dehydration due to alcohol consumption or the use of
diuretics
4) Dehydration due to heavy sweating during saunas, etc.
Accordingly, it is recommended that instructions be
provided to the subject to help eliminate these causes when
accurate measurements are needed.
kg
Time
Intra-day fluctuations (Weight)
5/13 Monday 5/14 Tuesday 5/15 Wednesday 5/16 Thursday
Ω
Time
Intra-day fluctuations (Impedance value)
5/13 Monday 5/14 Tuesday 5/15 Wednesday 5/16 Thursday
Time
Intra-day fluctuations ( %FAT)
5/13 Monday 5/14 Tuesday 5/15 Wednesday 5/16 Thursday
Inter-day changes in body fat percentage and
impedance measured by BIA between the feet
during normal daily routine and during
dehydration
THE APPLICABILITY OF THE BMR REGRESSION FORMULA AND
ITS DIFFERENCES WITH THE OLD FORMULA
The New Regression Formula for Basal Metabolic Rate (BMR)
It has long been said among medical and nutritional specialists that "The Basal Metabolic Rate (BMR) is
more determined by the Fat Free Mass (FFM) than by the body weight" (Persons of a given body weight
with a higher FFM will have a higher BMR), and that from the aspect of evaluating the body composition,
should be estimated from the FFM. In addition, in cases of simple estimation formulae which can calculate
from the height, weight and age, without evaluating the body composition, there was a problem with
excessively high evaluations being given to obese persons with large body weight, and conversely
excessively small BMR evaluations given to muscular athletes, though these are not as many in number.
Currently, the BMR estimation recursion formula developed by Tanita, the manufacturer of body
composition analyzers, based on their research, works by multiple regressive analysis using this FFM, and
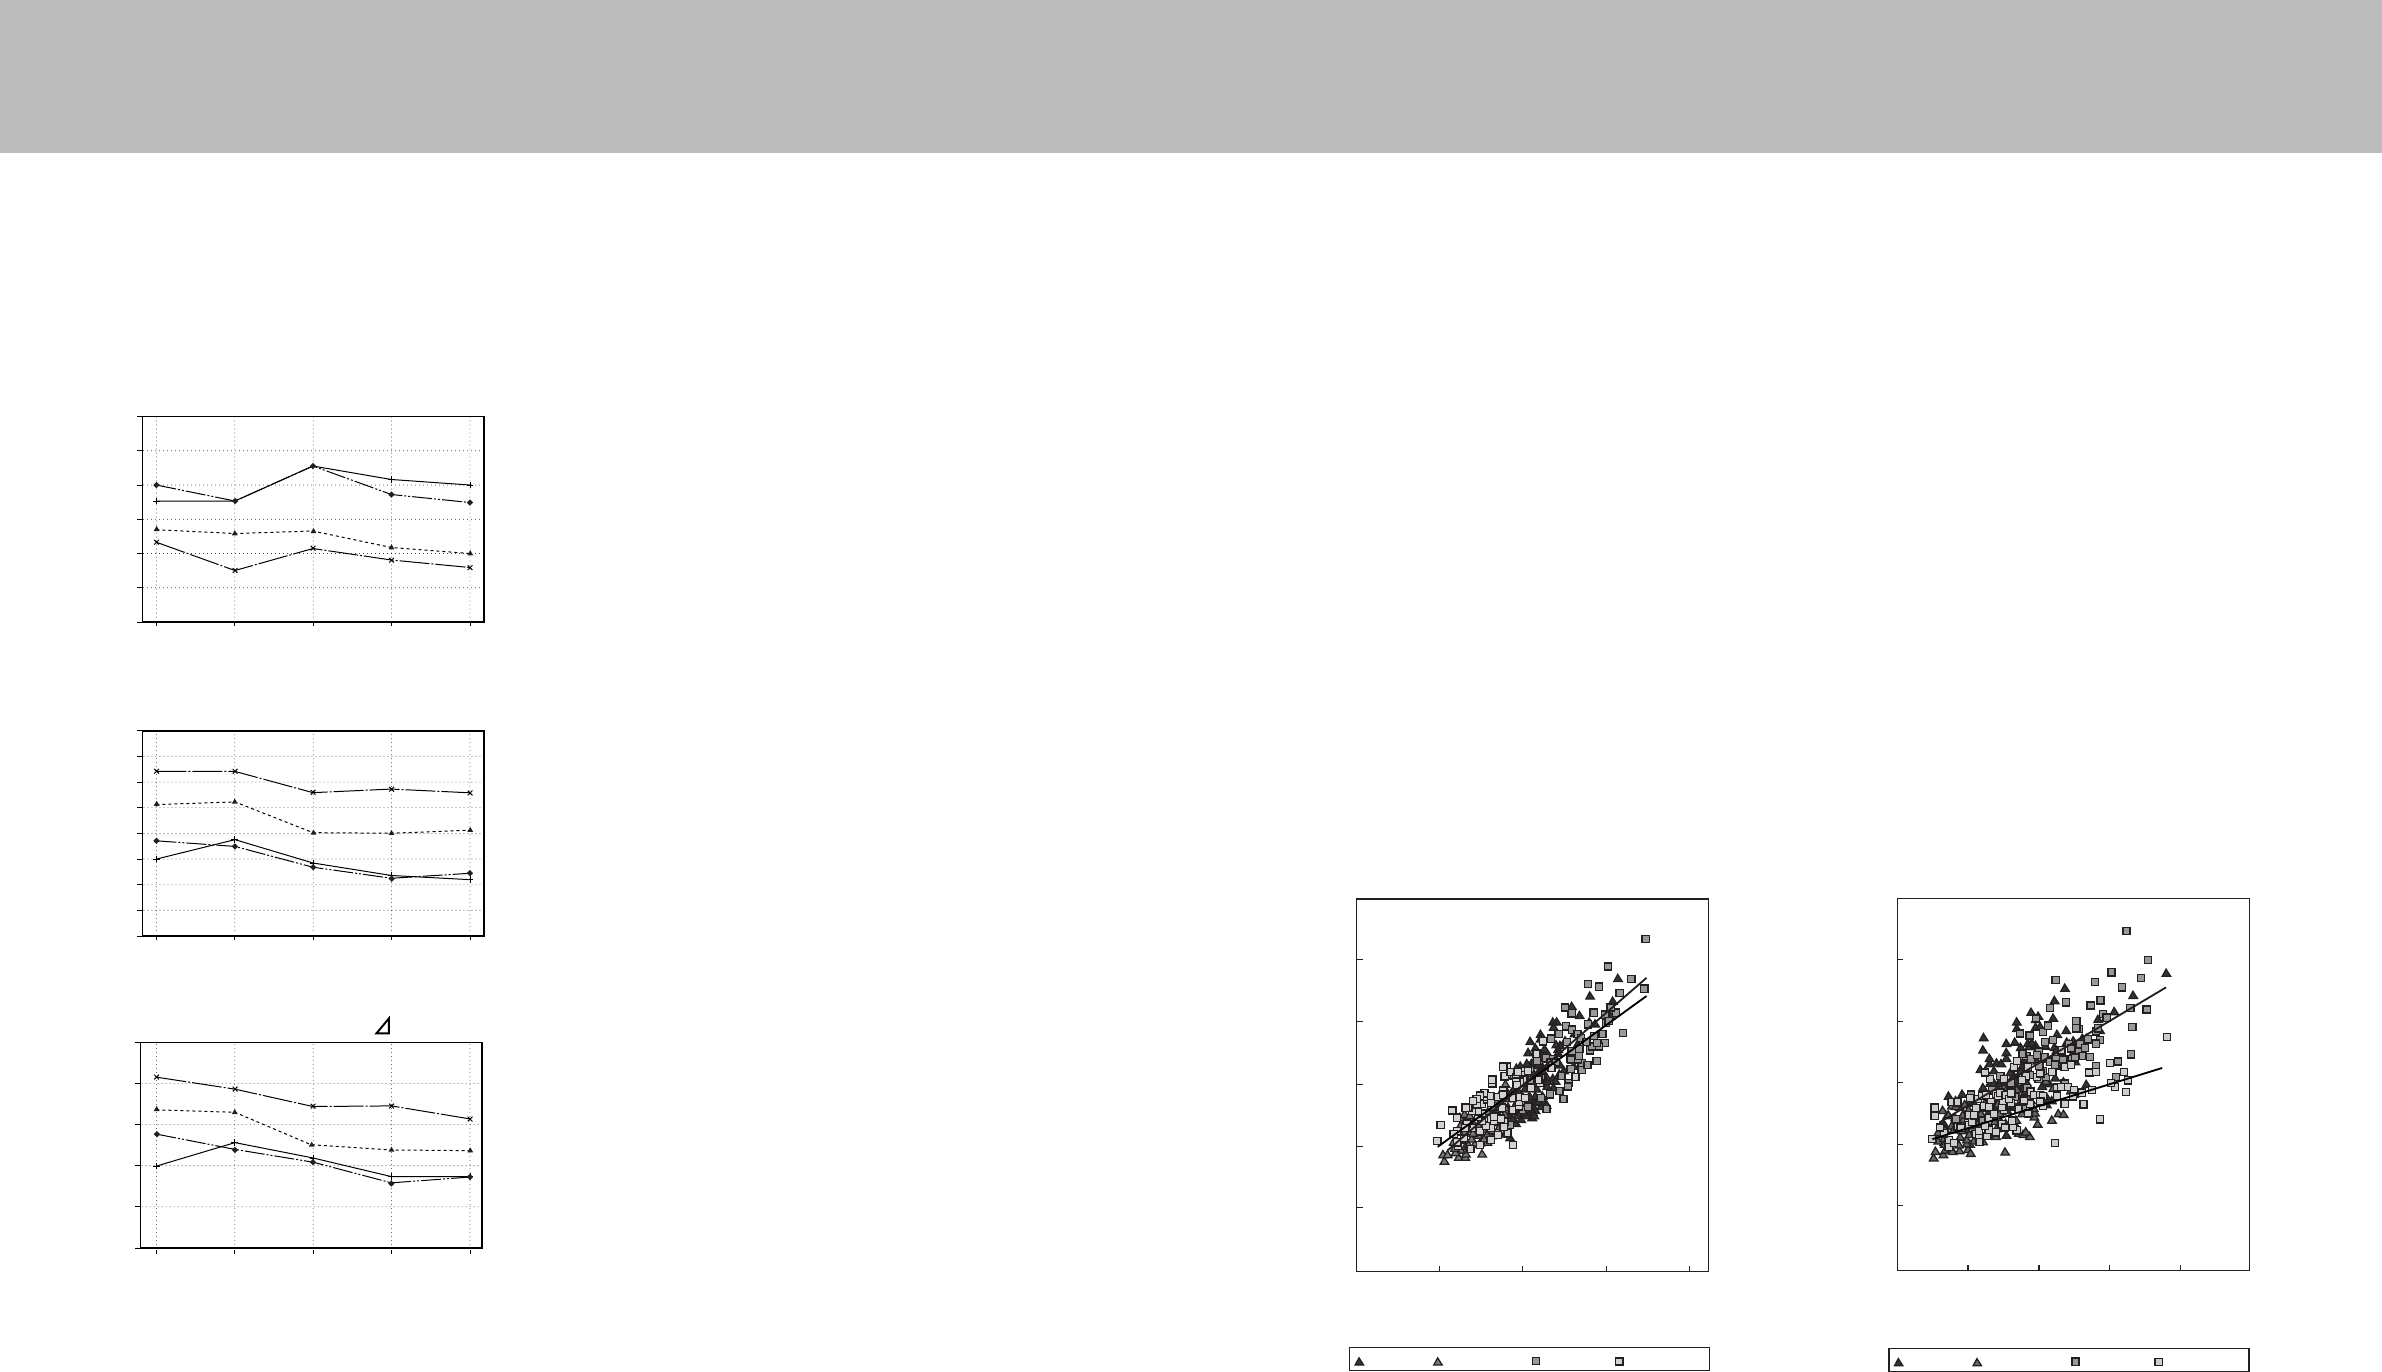
has a higher degree of accuracy in the individual differences in body composition. In order to derive the
BMR, resting respiratory metabolism (Resting Energy Expenditure: REE) was measured using a breath gas
analysis device, and this estimation recursion formula was created based on this data.
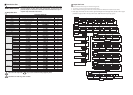
<Figure 1> The Relationship Between Resting Energy Expenditure (REE) According
to Breath Gas Analysis and Weight, FFM
(Presented at Nutrition Week, Held in San Diego in 2002)