XTRA Series • Operation
Operation, cont’d
3-10
XTRA Series • Operation
3-11
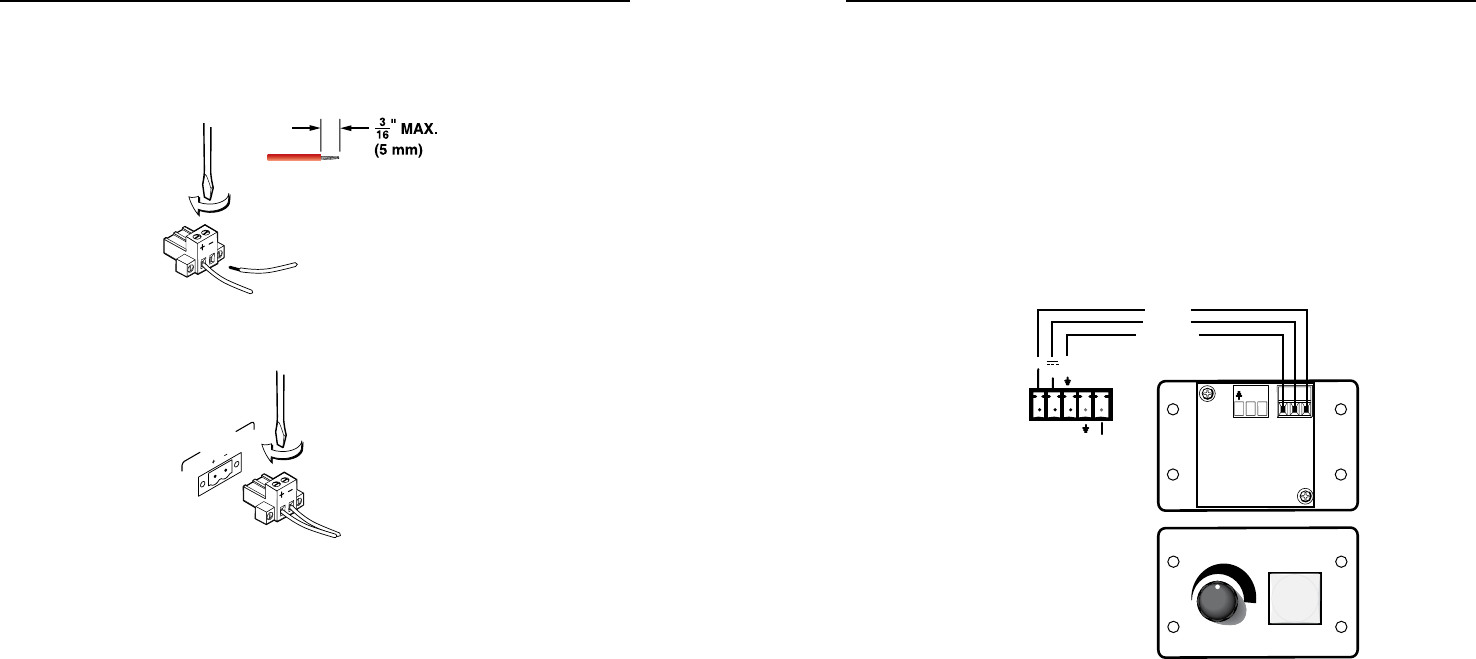
Step 1: Strip and insert the speaker wires into the connector and
tighten the captive screws. Be sure to observe
correct polarity.
Step 2: Insert the wired connector into the amplifier output
and secure the locking screws on either side.
Do not tin the wires!
OUTPUT
70V
h
High pass filter toggle switch — Use a Tweeker or small
screwdriver to toggle this recessed two-position toggle switch
that alternates between Off and 80 Hz. Setting the switch to
80 Hz prevents the saturation of 70 V/100 V speaker input
transformers by low frequency signals. Saturation may result in
undesired overheating of the speaker transformers.
N
Filtering may be unnecessary if filtering is applied to the
source input signal upstream of the amplifier.
Remote volume control
Options for remote control of the XPA ampliers include the
Extron VCM 100 and VC 50 volume controllers. Third party 10k
potentiometer volume controllers can also be connected to this
port.
As shown in the following illustration, the XPA's pin 1 is 10
VDC reference voltage. Pin 2 is volume control DC voltage,
range is 0 to 10 V, where 0 V is mute and 10 V provides
maximum volume. Pin 3 is ground.
N
All nominal levels are at ±10%.
VOL/
MUTE
10V
REMOTE
Red
Black
Ground
Extron
STP 22
Cable
VOLUME
VCM 100
MUTE
123 45
STANDBY
VOL/MUTE
10V 50 mA
Pinout diagram for VCM 100 MAAP connection to
XPA's remote connector
Bridged mono output
The power output of the XPA 1002 can be effectively doubled by
bridging the output. Bridging allows power to be output at 200
watts @ 8 ohms or 120 watts @ 16 ohms.
N
The bridging instructions that follow apply only to the
XPA 1002 model.
N
The minimum load impedance when bridging is 8 ohms.
To bridge the output, follow the steps and refer to the diagram
below:
1. Unplug the IEC power cord from the power amplier.
2. Wire the output as shown in the following diagram.


