


5
EN
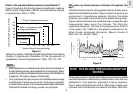
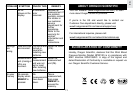
Why does my blood pressure fluctuate throughout the
day?
Individual blood pressure varies greatly both on a daily and a
seasonal or temperature basis. These variations may be more
pronounced in hypertensive patients. Normally the blood
pressure rises while at work and is at its lowest during sleep.
Figure 4 below illustrates the variations over a single day with
measurement taken every five minutes. The thick line
represents sleep time. The rises in blood pressure at 4 PM (A
in the graph) and 12AM (B in the graph) correspond to an
attack of pain and sexual intercourse (Beven, Honour &
Stott, Clin. Sci. 36:329, 1969).
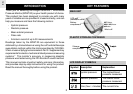
HOW THE BLOOD PRESSURE MONITOR
WORKS
This product uses the Oscillometric Measuring method to detect
your blood pressure. Before every measurement, the main unit
establishes a “zero pressure” equivalent to the air pressure.
Then it starts inflating the wrist cuff to 180mmHg or higher until
it senses that it has blocked your blood in the artery. After that,
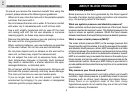
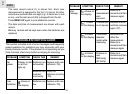
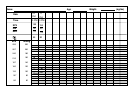
What is the standard blood pressure classification?
Figure 3 illustrates the blood pressure classification made by
World Health Organization (WHO) and International Society
of Hypertension (ISH) in 1999.
Reference material: 1999 World Health Organization-International
Society of Hypertension Guidelines for the management of
hypertension, Journal of Hypertension, 1999, 17(2): 151-183.
NOTE
• Blood pressure is considered high when either the diastolic or
systolic blood pressure value exceeds the normal range. When
a patient’s systolic and diastolic blood pressures fall into different
categories, the higher category should apply.
• Only a physician can tell you your normal blood pressure range
and the point at which you are at risk. Consult your physician
to obtain these values. If the measurements taken with these
products fall outside the range, consult your physician.
160
A B
TimePM
BLOOD PRESSURE
(mmHg)
AM
Sleep
140
120
100
80
60
40
20
12
13
14
15
16
17
18
19
20
21
22
23
24
1
2
3
45
6
7
8
9
10
11
Figure 4
120 130 140 150 160 180
Systolic Blood Pressure(mmHg)
Diastolic Blood Pressure (mmHg)
Figure 3
110
100
95
90
85
80
Grade 3 hypertension(severe)
Grade 2 hypertension(moderate)
High-normal Blood Pressure
Normal Blood Pressure
Optimal Blood
Pressure
Grade 1 hypertension(mild)
Subgroup:borderline
P/N: 086L003591-148 REV1
Page 6 of 122